Nutrition Optimization Concept Model: PREGNANCIES
1.0 Overview
This is the concept model document for the pregnancy component of the Nutrition Optimization simulation model. Documents that contain information specific to the overall model and the child subcomponent can be found here:
1.1 Modeling aims and objectives
Todo
List modeling aims and objectives
1.2 Outstanding research questions/notes
Questions:
For stillbirths that become live births due to intervention impact, what should their LBWSG exposure be? Hypothetically near-stillbirths should have lower birth weights than others. Ask Nick K.! GBD may be estimating these outcomes directly? Current assumption is that they will have randomly sampled exposure.
How should we handle averted stillbirths in our optimization objectives? Note that because stillbirths do not accumulate any DALYs, an objective to minimize DALYs could disincentivize averting stillbirths, which would be inconsistent with improving outcomes.
Notes/reminders:
BMGF would like to assume that those who take BEP also take MMS. This does not change our health impact model at all, but will change our costing assumptions (add product price of MMS to that of BEP).
The health systems team has not updated their iron supplementation in pregnancy coverage estimates from the values they provided for the IV iron simulation, so we will move forward with those estimates.
According to Will G. (GBD anemia modeler), our hemoglobin distribution is not exactly replicating the GBD anemia impairment prevalence because we were not using most-detailed location IDs. Notably, he mentioned that very small differences are expected to remain due to slight changes in covariate estimates between the time at which the hemoglobin/anemia modeling occurred and now.
We will remove background mortality from our pregnancy simulation so that simulants may only die due to maternal disorders.
2.0 Model design
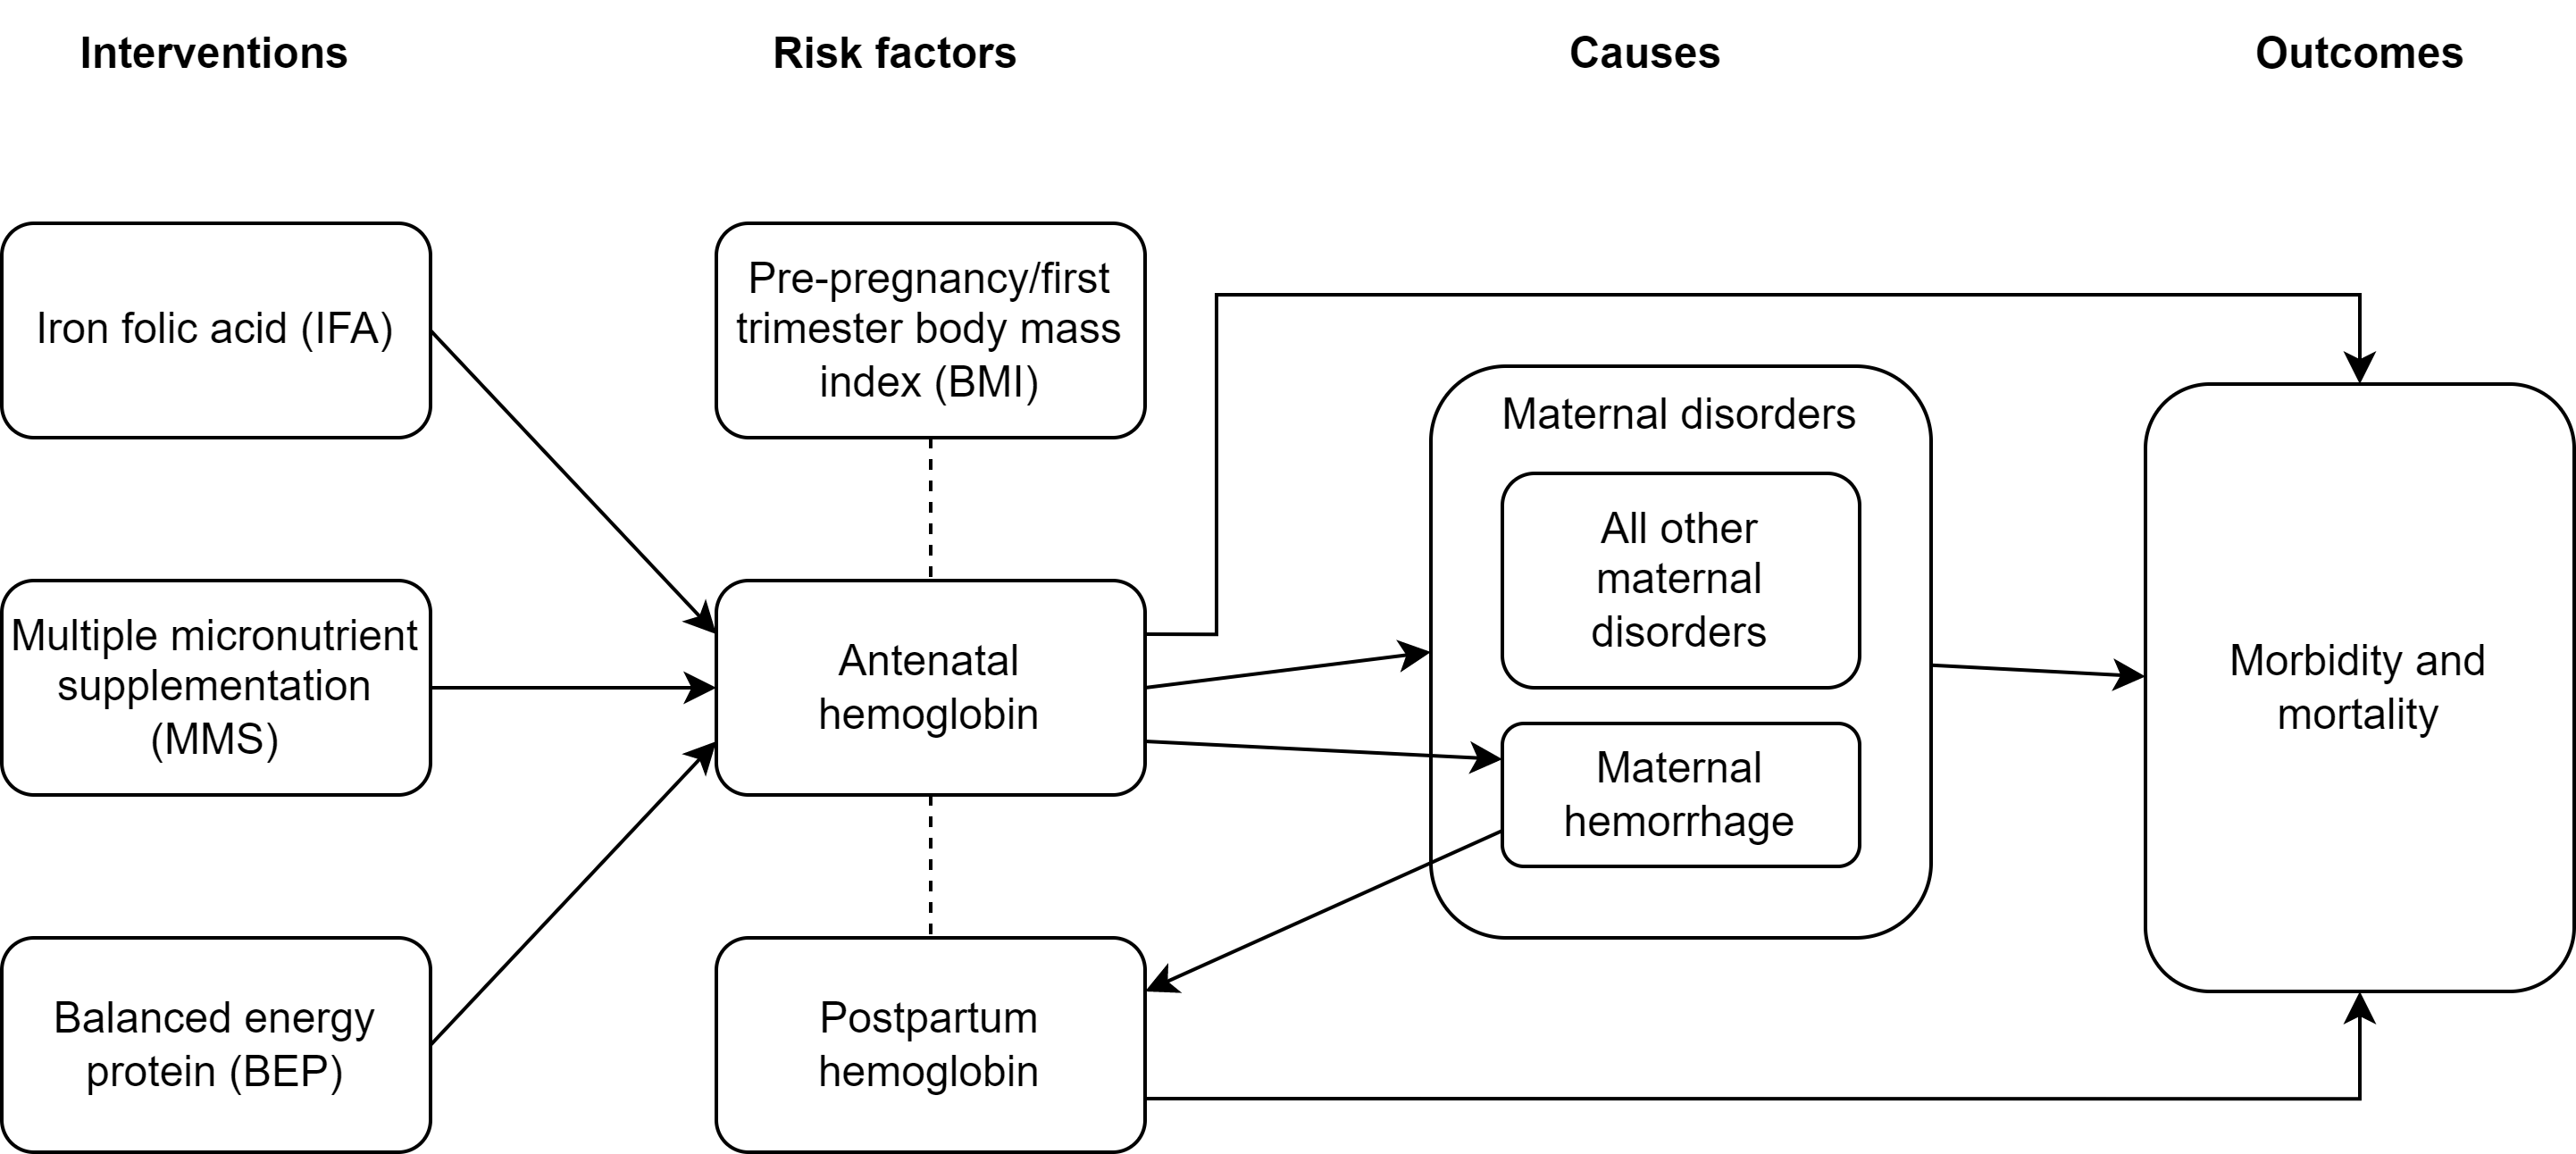
2.1 Concept model diagram
2.2 Submodels
Todo
Link individual model documents as they are completed and merged
Note
Unless specifically noted, only change from the IV iron implementation is the update from GBD 2019 to GBD 2021 data
Category |
Model |
Note |
|---|---|---|
Demography |
Change from IV iron due to closed cohort |
|
Risk exposure |
Wave II update to most detailed locs. |
|
Will need custom data update for 2021 (Ali) |
||
Risk correlation |
Will need custom data update for 2021 (Ali) |
|
Risk effects |
Hemoglobin , including effects on (1) maternal disorders, and (2) maternal hemorrhage incidence |
Do not include effect on birth outcomes (stillbirth), change from IV iron. Will need custom data update for 2021 (Ali) |
Causes |
||
Modeled causes: r192 (anemia). See note regarding exclusion of c366 below. Change from IV iron! |
||
Removal of background mortality due to other causes |
Change from IV iron |
|
Interventions |
Change from IV iron! New effects on gestational age and birth outcomes (no changes to hemoglobin effects). Also, coverage algorithm is updated |
Task |
Dependencies |
RT person |
ST person |
Note |
|---|---|---|---|---|
Model builds 0.0 through 1 |
. |
Done! (Ali) |
Done! (Patrick/Steve) |
New content from IV iron |
Model builds 2-6 |
. |
Docs ready, will need V&V (Ali) |
In progress (Patrick/Steve) |
No new content from IV iron (except one exclusion) |
Model build 7 |
. |
Docs ready, will need V&V (Ali) |
Patrick/Steve |
New content from IV iron |
Production runs |
. |
Ali |
Patrick/Steve |
Triple check everything is finalized and ready for next steps :) |
Task |
Dependencies |
RT person |
ST person |
Note |
|---|---|---|---|---|
Update hemoglobin distribution to most detailed locations |
Needs documentation (Ali) |
Patrick/Steve |
||
General GBD 2021 update |
Blocked by GBD timeline |
Ali (needs custom data updates for hemoglobin) |
Patrick/Steve |
|
Background morbidity |
. |
Ali |
Patrick/Steve |
Bonus task, not necessary for success |
Production runs |
Awaiting completion of above tasks |
Ali |
Patrick/Steve |
2.3 Default specifications
Parameter |
Value |
Note |
|---|---|---|
Location(s) |
Ethiopia (ID: 179) |
Eventually will also add Nigeria (214) and Pakistan (164) |
Number of draws |
10 |
May be increased for final runs |
Population size per draw |
100,000 |
Eventually to be refined based on test runs |
Cohort type |
Closed |
Change from IV iron! |
Sex |
Female only! |
|
Age start (initialization) |
10 |
|
Age start (observation) |
10 |
|
Age end (initialization) |
54 (inclusive) |
|
Exit age (observation) |
Age at which postpartum period ends |
|
Simulation start date |
2025-01-01 |
|
Simulation observation start date |
2025-01-01 |
(No burn-in period) |
Simulation end date |
2025-12-31 |
Needs to accommodate maximum gestation of 42 weeks + 6 weeks postpartum. Note this was previously 2025-12-3 and was updated for model 3.0. |
Timestep |
1 week (7 days) |
Note, could be increased to two weeks if duration of maternal disorders pregnancy state is updated. |
Randomness key columns |
[‘entrance_time’, ‘age’] |
2.4 Simulation scenarios
Scenario |
IFA coverage |
MMS coverage |
BEP coverage |
|---|---|---|---|
Zero coverage |
0 |
0 |
0 |
Baseline |
Baseline |
0 |
0 |
1: MMS |
0 |
1 |
0 |
2: IFA |
1 |
0 |
0 |
3: Targeted BEP/IFA |
1 for adequate BMI pregnancies |
0 |
1 for low BMI pregnancies |
4: Targeted BEP/MMS |
0 |
1 for adequate BMI pregnancies |
1 for low BMI pregnancies |
Where:
0 represents the minimum intervention coverage (0%, or no coverage)
1 represents the maximum intervention coverage (100%)
Baseline represents location-specific baseline IFA coverage, which can be found in location-specific .csv files here (note these values were calculated in this notebook
Note
Scenario #2 was previously “Universal BEP” rather than IFA, but was updated to IFA on 10/23/23 prior to wave II production runs. Universal BEP is no longer a scenario of interest.
2.5 Outputs
There are two important categories of outputs for this model. The first is maternal health data obtained from observing the simulants in the pregnancy simulation that will be used to inform maternal health outcomes in the emulator. The second is data that will be used as inputs to the child simulation (including information such as LBWSG risk exposure). The maternal health data will be recorded at the aggregate level, but the child health data will be recorded at the individual level.
Specific outputs for specific models are specified in the following section.
3.0 Models
Note
Unless otherwise specified, all maternal outputs should be stratified by maternal age group
Note
Models 2.0 through 6.0 do not contain any updates relative to the IV iron implementation (with the exception of the removal of the hemoglobin risk effect on birth outcomes/stillbirths). These model runs may be collapsed into fewer submodels if convenient for implementation.
If this is done, model output requests should be updated.
Run |
Description |
Scenarios |
Spec. mods |
Maternal outputs |
Child outputs |
Note |
|---|---|---|---|---|---|---|
0.0 |
Standard demography |
Baseline |
None |
|
N/A |
|
0.1 |
Pregnancy demography (docs here) |
Baseline |
None |
|
N/A |
All simulants initialized into the pregnancy state, but no other aspects of pregnancy model included |
1.0 |
Pregnancy state transitions (docs here). For now, all pregnancies have duration of 40 weeks. |
Baseline |
None |
|
N/A |
Note closed cohort change from IV iron pregnancy model. Custom observer exit at the end of postpartum period? (Bonus ask) |
1.1 |
“Term length” outputs (separation of live/stillbirth and abortion/miscarriage/ectopic pregnancies). For now, live/stillbirth pregnancies all have 40 weeks duration and abortion/miscarriage/ectopic pregnancies have duration as specified in docs. |
Baseline |
None |
|
Live/stillbirths paired with maternal_ids |
|
1.2 |
LBWSG outputs. Update pregnancy duration to reflect sex-specific LBWSG exposures and separate “live/stillbirths” into live birth and stillbirth outcomes. |
Baseline |
None |
|
Live and still births with maternal_ids and LBWSG exposures |
|
2.0 |
Maternal disorders and maternal hemorrhage cause models, removal of background mortality |
Baseline |
None |
|
N/A |
|
2.1 |
Maternal hemorrhage cause models |
Baseline |
None |
|
N/A |
|
3.0 |
Hemoglobin/anemia exposure |
Baseline |
None |
|
N/A |
|
3.1 |
Hemoglobin/anemia exposure with bugfixes |
Baseline |
None |
|
N/A |
|
4.0 |
Hemoglobin on maternal disorders, hemoglobin on maternal hemorrhage, and maternal hemorrhage on hemoglobin risk effects |
Baseline |
None |
|
N/A |
Do NOT include risk effect of hemoglobin on birth outcomes (which was included in IV iron). Data block for GBD 2021 update as of 6/23. |
5.0 |
BMI exposure with correlation to hemoglobin and LBWSG |
Baseline |
None |
|
Live and still births with maternal_ids, infant sex, maternal BMI exposure, maternal hemoglobin above/below 100 g/L, and LBWSG exposures |
Data block for GBD 2021 update as of 6/23. |
6.0 |
Intervention effects on hemoglobin and birthweight |
All |
None |
|
Live and still births with maternal_ids, infant sex, maternal BMI exposure, maternal hemoglobin above/below 100 g/L, intervention coverage, and LBWSG exposures |
Both of these intervention effects were implemented in IV iron and are not changed for this model |
7.0 |
Intervention effects on gestational age and birth outcomes |
All |
None |
|
Live and still births with maternal_ids, infant sex, maternal BMI exposure, maternal hemoglobin above/below 100 g/L, intervention coverage, and LBWSG exposures |
These intervention effects are new and were not implemented in IV iron |
8.0 |
Background morbidity |
All |
None |
|
N/A |
|
8.1 |
8.0bugfix |
All |
None |
Same as 8.0 |
Same as 8.0 |
|
8.2 |
Birth outcome randomness bugfix, stratify YLDs by pregnancy status |
All scenarios |
None |
|
Same as 8.0 |
|
8.3 |
All scenarios, including new “zero coverage” scenario |
None |
Same as 8.2 |
Same as 8.2 |
||
9.0 |
Production run test |
All |
2,000,000 population size per draw, 5 draws |
No age stratification and not cause-specific, BUT stratified by random seed:
|
Live and still births with maternal_ids, infant sex, joint BMI/anemia exposure, intervention coverage, and LBWSG exposures |
Will analyze to determine minimum viable population size for maternal outcomes (can later use child data to analyze for child outcomes) |
9.1 |
Production runs |
All |
1,600,000 population size per draw, 100 draws |
Same as 9.0, but no longer stratified by random seed |
Live and still births with maternal_ids, infant sex, joint BMI/anemia exposure, intervention coverage, and LBWSG exposures |
NOTE: This population size has not yet been tested in the child model; however, as maternal mortality is more rare than child mortality it is expected to be sufficient |
9.2 |
Production runs with intervention count observer fix (just once at 6 weeks instead of every timestep) |
All |
Same as 9.1 |
Same as 9.1 |
Same as 9.1 |
|
10.0 |
Nigeria and Pakistan locations |
All |
400,000 population size per draw, 20 draws |
|
Same as 9.1 |
The underlying model should be identical to 9.1 except for locations and the modifications noted here |
10.1 |
Production runs with live birth and still birth counts |
All |
Same as 9.2 |
Same as 9.2 but including count of live births and still births |
Same as 9.2 |
|
11.0 |
GBD 2021 update |
All |
400,000 population size per draw, 20 draws |
|
Same as 9.2 |
Should be the same as the adding locations test runs |
11.1 and 11.2 |
GBD 2021 update, but with year=2021 rather than year=2022 and disability due to other causes (“background morbidity”) excluded |
All |
400,000 population size per draw, 20 draws |
|
Same as 9.2 |
Should be the same as the adding locations test runs |
12.0 |
GBD 2021 production runs |
All |
Same as 9.2 |
Same as 9.2 but including count of live births and still births |
Same as 9.2 |
|
|
Runs that integrate vivarium and vivarium_public_health framework updates to confirm we still meet V&V criteria following these updates |
All |
10 draws, 10 seeds with 20,000 population (200,000 pregnancies per draw). Nigeria and Pakistan only |
Default |
Default |
Note
Model build ordering determined with the following in mind https://blog.crisp.se/2016/01/25/henrikkniberg/making-sense-of-mvp
Model |
V&V plan |
V&V summary |
|---|---|---|
0.0 |
Proportion of deaths in each age group is as expected from GBD ACMR estimates among WRA |
Overall seems to be functioning as expected, but would like to add person-time observer to results. Notebook can be found here. |
0.1 |
Check that distribution of observed person-time by age group matches distribution of pregnancies in GBD, check ACMR |
Looks great! Some deviation from GBD ACMR at edge age groups as a result of small numbers, but not a concern. Model 0.1 V&V notebooks can be found here |
1.0 |
Confirm pregnancy transitions occurring and at the expected intervals. For this model, all pregnancies hard coded for duration of 40 weeks. Postpartum period duration of 6 weeks. |
Looks great! Note that pregnancy duration skews when evaluated at age-specific level, but this is not a bug in implementation, rather in analysis. Model 1.0 V&V notebook can be found here |
1.1 |
Confirm that relative distribution of abortion/miscarriage/ectopic pregnancies versus live/stillbirth pregnancies is as expected, that abortion/miscarriage/ectopic pregnancy duration implemented as expected, and that child data looks good |
Looks great! Model 1.1 V&V notebook can be found here |
1.2 |
|
Looks good! Model 1.2 V&V notebook can be found here. Noted that infant sex should be added to child output data moving forward. |
2.0 |
Verify incident and fatal maternal disorder rates as well as YLDs, confirm removal of background mortality |
Model 2.0 V&V notebook available here
|
2.1 |
Verify that maternal disorders CSMR has been fixed and that maternal hemorrhage incidence is as expected |
Model 2.1 V&V notebook available here * Maternal disorders CSMR now validating, except for zero value for 50-55 year olds (see explanation in table below) * Maternal hemorrhage incidence is validating, except for zero value for 50-55 year olds (see explanation in table below) |
3.0 |
Verify anemia prevalence and YLDs, postpartum state duration |
Anemia prevalence looks good among pregnant population, too high among non-pregnant population. Anemia YLDs too high. Simulation duration extended to one year fixed postpartum duration oddities, now exactly equal to six weeks. Model 3.0 V&V notebooks available here |
3.1 (3.0bugfix) |
Verify no person time in the not-pregnant state, check anemia YLDs |
Both look good! Model 3.1 V&V notebooks available here |
4.0 |
|
|
5.0 |
Verify that joint anemia/BMI risk exposure matches expected value and that exposure does not change over time with changing hemoglobin |
|
6.0 |
|
|
7.0 |
Verify that intervention impacts on stillbirths were applied as expected |
Looks great! See the model 7 birth outcome V&V here |
8.0 |
|
|
8.1 |
Verify that other causes disability weight is now as expected |
|
8.2 |
|
|
8.3 |
|
All looks good! Ready to move to production :). 8.3 notebook available here |
10.0 |
|
All looks good! Ready to move to production runs. Nigeria notebook and Pakistan notebook. Note for Pakistan notebook that the parent ID used was 159 which was different than expected. We are investigating this but think it is an issue with target data generation NOT with the model. |
11.0 |
|
Model 11.0 V&V notebook (Ethiopia only) available here * Anemia prevalence is underestimated * Pregnancy outcome observer appears to be recording once per timestep rather than once per simulation |
11.1 |
|
V&V notebooks for model 11.1 can be found here * Anemia prevalence looks good! * 2021 data update as expected * Birth outcome observer looks as expected * YLDs due to other causes successfully removed * Zero YLDs due to maternal disorders |
11.2 |
|
V&V notebooks for model 11.2 can be found here * Maternal disorders YLDs now look as expected – ready to move on to production runs * Also confirmed that the birth outcome observer is capturing outcomes among all simulated individuals, including those who die during the simulation |
|
All V&V checks |
All models are meeting V&V criteria. Notebooks linked below have been updated to support the results management system format as of March 2026, but currently only support a single location at once. |
Issue |
Explanation |
Action plan |
Timeline |
|---|---|---|---|
Zero values for 50-55 year old age group |
Vivarium inputs fills maternal disorders deaths and maternal hemorrhage incidence with zeros due to |
Acceptable limitation given very low pregnancy incidence in this age group |
N/A |
Slight underestimation of maternal disorders incidence and mortality |
GBD maternal disorders parent cause is equal to the sum of maternal disorders sub-causes. Therefore, the incidence of the aggregate maternal disorders cause is quite high relative to the rate of pregnancies and when it is increased due to risk effects from hemoglobin, the calculated probability of an incident case can be greater than one. Since these probabilities are capped at one, we end up underestimating the incidence rate of maternal disorders at a population level. Note that this issue was present in the IV iron implementation; however, in the nutrition optimization implementation, maternal disorders mortality is conditional on maternal disorders incidence (whereas mortality was correlated with incidence, but not conditional on incidence in the IV iron implementation). Therefore, we are slightly underestimating maternal disorders mortality in this model. |
As the underestimation is slight, we will move forward despite this limitation. In the meantime, we will investigate possible solutions to address this issue (in particular, modeling each individual maternal disorders sub-cause within the simulation), which we may consider incorporating into the model after other higher priority updates are made (such as intervention implementations in models 6 and 7) |
TBD |
4.0 Research background and limitations
4.1 A note on years lived with disability and maternal disorders
This simulation has taken a particular modeling strategy regarding years lived with disability due to maternal disorders that involved integrating it into the pregnancy model.
While described in more detail on the individual model documents, the main strategic decisions made in the design of this model are outlined below, with explanations:
Modeling a specific “maternal disorders” state in the pregnancy model document with a duration of a single timestep that occurs between the pregnancy and postpartum states in which a simulant is either affected or unaffected by the maternal disorders cause.
Modeling the maternal disorders state with the duration of one timestep (rather than an instantaneous moment at birth) allowed us to take advantage of standard vivarium behavior for accruing YLDs over the duration of time spent in the state according to a state-specific disability weight (custom calculated in this case).
Modeling YLDs due to maternal disorders according to a custom calculated “disability weight” equal to the annual amount of YLDs due to maternal disorders per non-fatal case of maternal disorders rather than the typical strategy of prevalence-weighted average of sequela-specific disability weights.
We took this strategy because the maternal disorders cause is a composite parent cause of many maternal disorders subcauses (see the maternal disorders document). These subcauses all have differing disability weights as well as average durations. Therefore, by using the GBD COMO-adjusted YLD estimates to back-calculate a “disability weight” for the composite maternal disorders parent cause that results, we can produce the appropriate COMO-adjusted annual baseline rate of maternal disorders YLDs without needing to account for the differential DWs and durations of each of the maternal disorder subcauses to appropriately replicate the COMO adjustment within the simulation.
Note that a limitation of this strategy is that there are some sequelae within the maternal disorders cause that last for longer than one year. Because of this, some of the YLDs in the GBD estimate of the COMO-adjusted annual YLD rate due to maternal disorders will be due to births that occurred in the year prior to our index year; we will therefore assign some of these YLDs due to prevalent cases to incident cases in our simulation. However, we are additionally limited in that we do not consider disability due to incident maternal disorder cases beyond one year after birth. Note that for the baseline scenario, these two limitations should cancel out so long as the incidence of these long-lasting sequelae are stable over time after adjusting for changing fertility rates.
Pausing accumulation of YLDs due to causes other than maternal disorders (specifically anemia, other causes) while simulants occupy the maternal disorders state in the pregnancy model.
We took this strategy because the maternal disorders YLDs as calculated above are already COMO adjusted. Therefore, we do not wish to further adjust these YLDs for comorbid causes that a simulant may possess.
Note that this causes underestimation of YLDs due to causes other than maternal disorders from the start of pregnancy until six weeks postpartum by roughly a factor of 1/38 (~2.16 percent) for this simulation given a timestep of one week and an average pregnancy + postpartum combined duration of approximately 38 weeks (6 weeks postpartum + 32 weeks of pregnancy, weighted average of live/stillbirth and abortion/miscarriage/ectopic pregnancies). - We have addressed this limitation during post-processing for the IV iron simulation by multiplying YLDs due to anemia accrued during the postpartum state by
6/5given that the duration of the maternal disorders state was one week and the duration of the postpartum state was 5 weeks.
Todo
Determine if we wish to replicate this anemia YLD re-scaling strategy for this simulation (trade off between observer stratification and associated increases in run time). Will need to update final output/stratification requests if desired.
Not including maternal disorders as a “modeled cause” in the model of morbidity due to “other causes,” as discussed on this page.
This allows us to adjust YLDs due to causes other than maternal disorders to be COMO-adjusted for maternal disorders, since this adjustment will not be done within the simulation despite the fact that we are modeling maternal disorders due to our unique modeling strategy for this cause. Note that YLDs due to maternal disorders in our simulation are already COMO-adjusted for all other causes because we are using the GBD COMO-adjusted YLD estimate to calculate the maternal disorders disability weight, as described above.
Note that this modeling strategy does not allow for intervention-associated reductions in YLDs due to maternal disorders to cause increases in YLDs due to causes other than maternal disorders (which should occur for comorbid causes, as discussed on this page) and vise versa (reductions in YLDs due to anemia will not increase comorbid YLDs due to maternal disorders). However, given that each of these individual causes represents a small portion of all cause YLDs for our modeled demographic groups, the impact of this limitation will be small.
Modeling YLDs and YLLs due to maternal hemorrhage as part of the maternal disorders composite cause rather than part of the maternal hemorrhage incidence cause (which has no associated morbidity or mortality).
We did this in order to remain consistent with GBD. The GBD hemoglobin risk effect applies equally to all maternal disorders subcauses (in other words, the hemoglobin relative risks are specific to all maternal disorders and we do not have data for cause-specific hemoglobin risk effects). Therefore, we model the risk effect of hemoglobin on maternal disorders as a composite cause (including hemorrhage) and model maternal hemorrhage incidence only as a way to estimate the impact of pregnancy hemoglobin on postpartum hemoglobin as mediated through hemorrhage at birth.
Note that it is possible that we could use the more specific hemoglobin on maternal hemorrhage risk effects obtained from the literature to apply to maternal hemorrhage morbidity and mortality, but we chose to remain consistent with GBD rather than model more detailed risk effects for this single specific subcause of maternal disorders.