Vivarium CSU Cervical Cancer Simulation
Label |
Definition |
|---|---|
S |
susceptible |
hrHPV |
high-risk HPV |
S_hrHPV |
without high-risk HPV infection |
C_hrHPV |
with high-risk HPV infection |
BCC |
benign cervical cancer |
ICC |
invasive cervical cancer |
R |
recovered |
Tx |
treatment |
CI claim |
critical illness claim |
ACMR |
all-cause mortality rate |
prev_c432 |
prevalence of cervical cancer |
incidence_c432 |
incidence of cervical cancer |
csmr_c432 |
cause-specific mortality rate of cervical cancer |
see full disease state definition
1.0 Background
1.1 Project overview
This project will generate forecasts of cervical cancer mortality and morbidity to allow Swiss Re to identify trends that are important to its business decision-making. IHME will produce both a baseline (business as usual) forecast, and an alternative scenario forecast in which key cervical cancer screening practice and HPV vaccination are implemented in a simulation framework. Baseline forecasts will incorporate expected trends in relevant risk factors. Alternative scenario forecasts will incorporate baseline forecasts and the expected impact of new screening technologies and vaccination. All forecasts will represent the Swiss Re’s insured population from the weighted blend of Chinese provinces. Forecasts run from year 2020 to 2040.
1.2 Literature review
Todo
add more literature background
2.0 Modeling aims and objectives
IHME will estimate the yearly number of cases of benign and invasive cervical cancer detected under specific cervical cancer screening practices and the yearly number of deaths from undetected cervical cancer (both in unit of per 100,000 insured person-years) in order to identify pay-out trends for cervical cancer claims.
3.0 Causal framework
3.1 Causal variables
- Outcome
Cervical cancer detection (benign and invasive)
Mortality and morbidity of cervical cancer
- Most proximal determinant/exposure
Cervical cancer status
Cervical cancer screening
HPV infection
HPV vaccination status
- Confounders
age
sex
- Effect modifiers
N/A
- Mediators
N/A
4.0 Intervention
There is an urgent need to implement the evidenced-based interventions (e.g. HPV vaccination, cervical cancer screening, management of detected disease) for eliminating cervical cancer as a public health problem, such action must be strategic in nature. [WHO cervical cancer elimination strategy]_
Based on SwissRe’s interest, our simulation intervention combined the cervical cancer screening and HPV vaccination to evaluate the cervical cancer detection in following scenarios:
Baseline (status quo scenario): keep HPV vaccination and cervical cancer screening coverage constant over time among insured female.
Alternative (expected future scenario): scale-up of both cervical cancer screening and HPV vaccination over time among insured female.
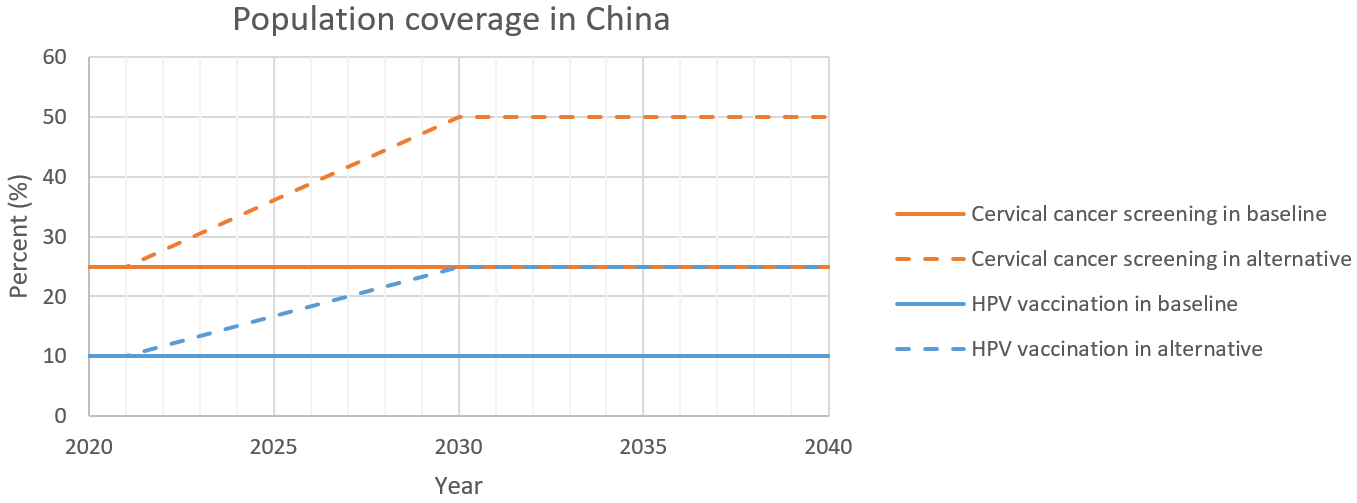
4.1 Simulation scenarios
Baseline: by 2040, project existing level of cervical cancer screening for insured female aged 21 to 65 years and HPV vaccination for insured female aged 15 to 45 years.
Alternative scenario: by 2030, linear ramp up cervical cancer screening to cover 50% of the insured female aged 21 to 65 years and HPV vaccination to cover 25% of the insured female aged 15 to 45 years. Both of the HPV vaccination and cervical cancer screening coverage remain constant in 2030 to 2040.
Scenario |
Intervention |
Year |
Coverage |
|---|---|---|---|
Baseline |
Cervical cancer screening |
2020-2040 |
25% |
Baseline |
HPV vaccination |
2020-2040 |
10% |
Alternative |
Cervical cancer screening |
2020-2030 |
Stay 25% in 2020-2021, then linearly ramp up from 25% to 50% in 2021-2030. |
Alternative |
Cervical cancer screening |
2030-2040 |
50% |
Alternative |
HPV vaccination |
2020-2030 |
Stay 10% in 2020-2021, then linearly ramp up from 10% to 25% in 2021-2030. |
Alternative |
HPV vaccination |
2030-2040 |
25% |
Note
Wang et al. reported a current cervical cancer screening coverage of 20.7% with 95%CI 18.6-22.8 in China. We set it as 25% as we believe insured population has higher screening coverage than general population.
No data has identified for current HPV vaccination rates in China. Temporarily we will use 10%.
The target HPV vaccination and cervical cancer screening coverage in 2030 are guided by IHME and SwissRe’s assumption for Chinese insured female.
5.0 Vivarium modelling components
5.1 Vivarium concept model

5.2 Demographics
5.2.1 Population description
Cohort type: Closed cohort of 200,000 insured female (100%) simulants.
Age and sex: Age 15 to 95+, 5 year-age bands, uniformly distributed age and sex structure.
Time span: Jan 1, 2020 to Dec 31, 2040 with 36.5-day time-steps.
Location: blended with province-specific weight in China.
5.2.2 Location description
Provinces to model include Tianjin, Jiangsu, Guangdong, Henan, and Heilongjiang. The uniform distribution of age and sex structure will be used among the different provinces.
Province |
location id |
Weight |
Weighted ACMR (per person-year) |
Weighted prev_c432 (proportion) |
Weighted incidence_c432 (cases per person-year) |
Weighted csmr_c432 (per person-year) |
|---|---|---|---|---|---|---|
Tianjin |
517 |
18% |
ACMR * 18% |
prev_c432 * 18% |
incidence_c432 * 18% |
csmr_c432 * 18% |
Jiangsu |
506 |
28% |
ACMR * 28% |
prev_c432 * 28% |
incidence_c432 * 28% |
csmr_c432 * 28% |
Guangdong |
496 |
22% |
ACMR * 22% |
prev_c432 * 22% |
incidence_c432 * 22% |
csmr_c432 * 22% |
Henan |
502 |
16% |
ACMR * 16% |
prev_c432 * 16% |
incidence_c432 * 16% |
csmr_c432 * 16% |
Heilongjiang |
501 |
16% |
ACMR * 16% |
prev_c432 * 16% |
incidence_c432 * 16% |
csmr_c432 * 16% |
Note
GBD (2019 round) cervical cancer forecast data can be found at /ihme/csu/swiss_re/forecast
ACMR: 294_deaths_12_29_ng_smooth_13.csv
prev_c432: 432_prevalence_12_29_ng_smooth_13.csv
incidence_c432: 432_incidence_12_29_ng_smooth_13.csv
csmr_c432: 432_deaths_12_29_ng_smooth_13.csv
See column noised_forecast for output value.
5.3 Models
5.3.1 Core cervical cancer model
5.3.2 Screening and detection model
I. Screening algorithm
- Cervical cancer screening algorithm was determined by three variables
Sex
Age
Diagnosis of HPV infection

Branch |
Sex |
Age |
Screening technology |
Screening frequency |
Screening result |
Follow-up test |
Follow-up frequency |
|---|---|---|---|---|---|---|---|
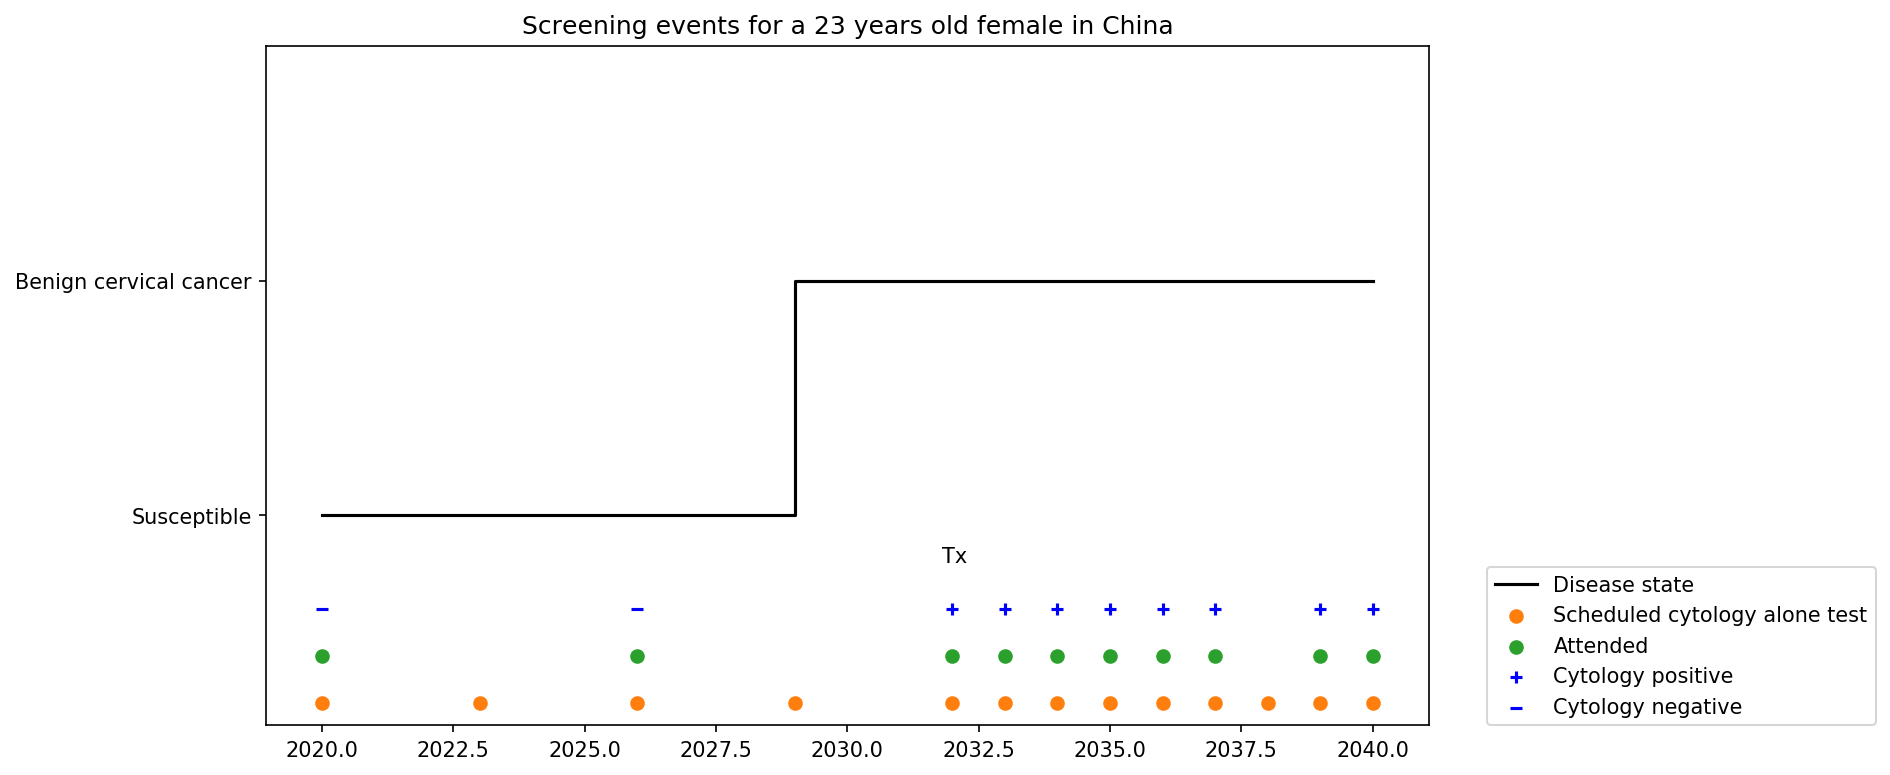
A |
Female |
21-29 |
Cytology |
in 3 years |
Cytology positive |
Cytology |
in 1 year |
A |
Female |
21-29 |
Cytology |
in 3 years |
Cytology negative |
Cytology |
in 3 years |
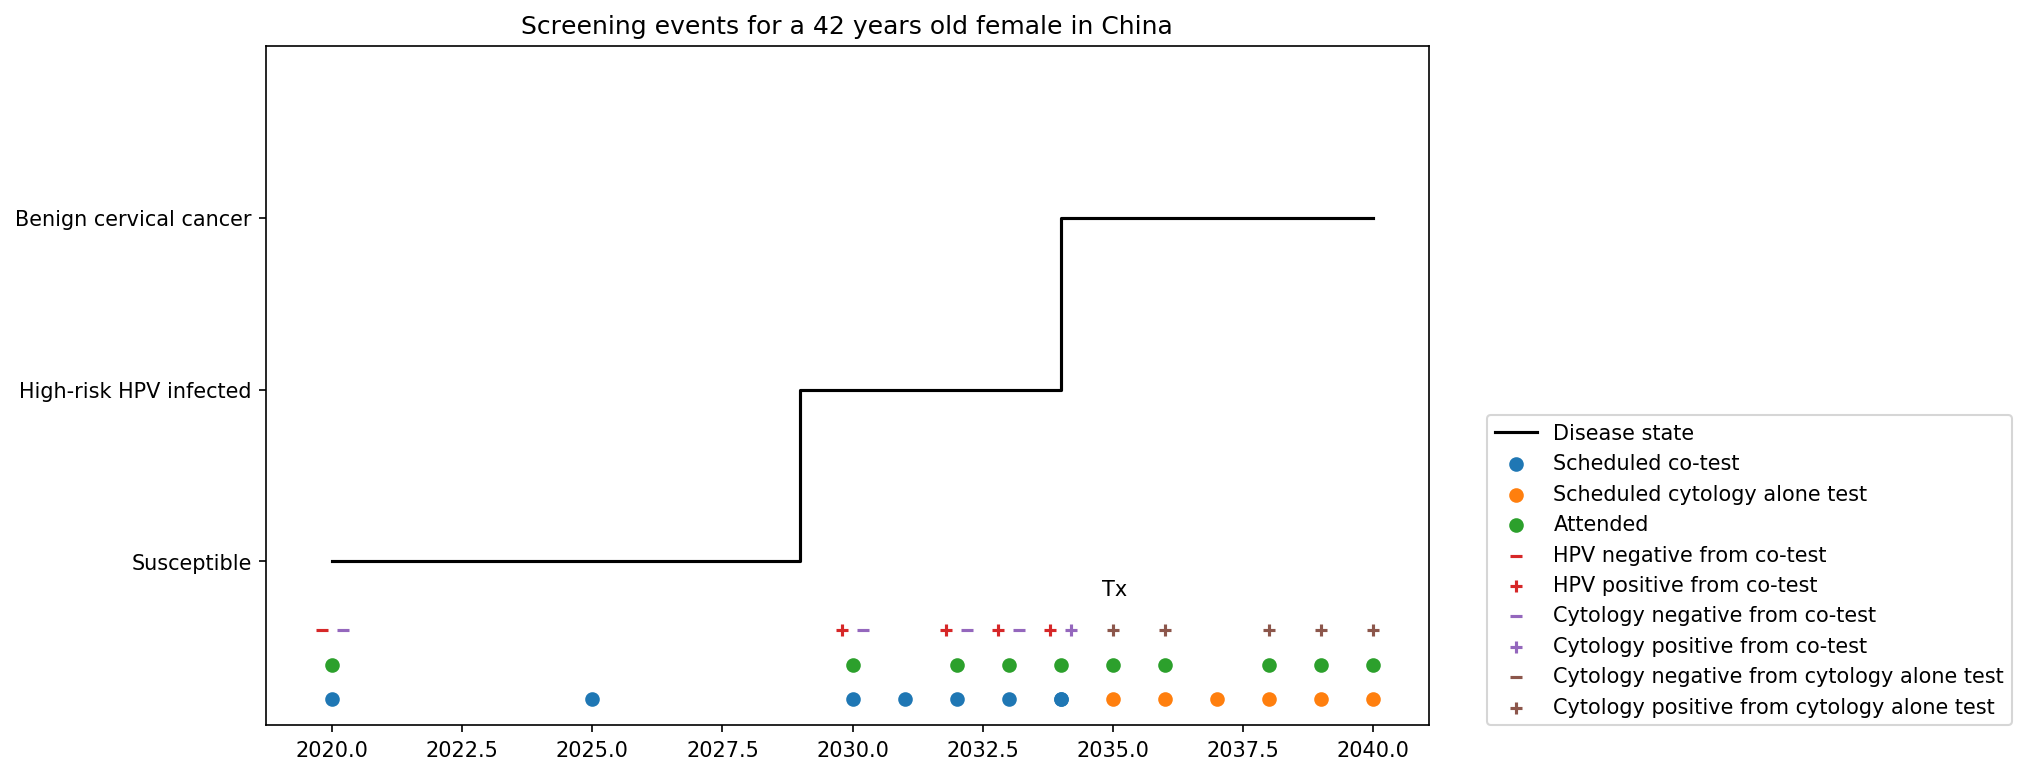
B |
Female |
30-65 |
Cytology plus HPV test |
in 5 years |
HPV negative, Cytology negative |
Cytology plus HPV test |
in 5 years |
B |
Female |
30-65 |
Cytology plus HPV test |
in 5 years |
HPV positive, Cytology negative |
Cytology plus HPV test |
in 1 year |
B |
Female |
30-65 |
Cytology plus HPV test |
in 5 years |
HPV negative, Cytology positive |
Cytology |
in 1 year |
B |
Female |
30-65 |
Cytology plus HPV test |
in 5 years |
HPV positive, Cytology positive |
Cytology |
in 1 year |
C |
Female |
<21 or >65 |
No screening |
Screening technology |
Sensitivity |
Specificity |
|---|---|---|
Cytology plus HPV test |
HPV+: 76.7% |
HPV-: 94.1% |
Cytology plus HPV test |
Cytology+: 59.1% |
Cytology-: 100% |
Cytology |
65.9% (95% CI 54.9 to 75.3) |
100% |
Note
Co-test (cytology plus HPV test) is not recommended for women under 30 according to guidelines from American Cancer Society and U.S. Preventive Services Task Force.
We are not testing HPV for women under 30 and those follow-up with cytology alone in one year at Branch B.
Women who have been vaccinated or detected BCC and treated should continue to be screened.
HPV- specificity value 94.1% is HPV test alone as a proxy for co-test HPV test specificity ( Reference paper )
In initialization, We assume that
No one has prior knowledge of their disease status (and HPV status) on day one of the simulation.
All simulants are buying insurance on day one of the simulation.
For simulants in cervical cancer (CC) state regardless of detection, they have a transition rate of 0.1 (per person-year) of moving into a recovered (R) state; this results in an average duration in state CC of 10 years. People in state CC and R follow exactly the same screening algorithm, namely branch A, B, or C depending on their age. Simulants do not ever make a second cervical cancer claim, therefore the negative screening results were expected for those in R state in order to avoid double counting the CI claim from detected cervical cancer.
II. Screening schedule and attendance
- Probability of attending screening
Generate 1000 draws from normal distribution with mean=0.25, SD=0.0025 for calculating the probability of simulants attending their first due screening.
If simulant attended their last screening, they have a truncated normal distirbution with mean=1.89, SD=0.36, lower=1.0 (Yan et al. 2017) more odds of attending the next screening than those who did not attend their last screening.
Time to next scheduled screening
Screening method |
Distribution |
Mean |
Standard deviation |
Lower limit |
Upper limit |
|---|---|---|---|---|---|
Cytology in 3 years |
Normal distribution |
1185 |
72 |
||
Cytology plus HPV test in 5 years |
Normal distribution |
1975 |
72 |
||
Annual cytology |
Truncated normal distribution |
395 |
72 |
180 |
1800 |
III. Screening initialization
The date of the first screening appointment (T_appt) for females at age between 21 and 65 is determined as follows. We assume that each simulant had a previous appointment scheduled at some point before the simulation begins. We calculate the time between that past appointment and their next appointment (delta_T) using the methodology outlined in Section 5.3.2.II (Time to next scheduled screening). With a uniform distribution we randomly determine how far along that time interval between appointments each individual is (X) at the beginning of the simulation ( T_0). For females under 21 when the simulation begins the methodology is identical, except T_0 is the simulant’s 21th birthday rather than the beginning of the simulation. No screening appointment will be initialized for females above 65.

IV. Simulant screening trajectory
Screening events for women aged 21-29 years
Screening events for women aged 30-65 years
V. Symptomatic presentation
In our model, cancer cases are detected through two pathways. (1) individuals who get diagnosed from routine screening with a positive test result. (2) individuals who didn’t go for routine screening but found symptoms then get diagnosed. After we add symptomatic presentation module, we will see detected cancer cases in cohorts not eligible for routine screening and a smaller difference of detection rate between baseline and alternative scenario. We assume symptoms will not occur in pre-invasive cervical cancer state, the transition rate (lambda) from pre-clinical screening detectable asymptomatic invasive cervical cancer (PC) to clinical symptomactic invasive cervical cancer is equal to 1 divided by average time spent in PC state (mean sojourn time). In cervical cancer development, the mean sojourn time is around 4 years.

5.3.3 HPV model
I. Disease model inputs
prevalence: /ihme/costeffectiveness/vivarium_csu_cancer/hpv_prevalence_dismod.csv
Incidence: /ihme/costeffectiveness/vivarium_csu_cancer/hpv_incidence_dismod.csv
remission: /ihme/costeffectiveness/vivarium_csu_cancer/hpv_clearance_dismod.csv
relative risk of HPV 16 and/or 18 causing CIN2+ (RR_hrHPV): use log-normal distribution exp(normal(mean=log(27.4), SD=0.17))
- relevant formulas
PAF = \(\frac{\text{prev\_hrHPV}\times(\text{RR\_hrHPV}-1)}{\text{prev\_hrHPV}\times(\text{RR\_hrHPV}-1)+1}\)
\(\text{incidence\_BCC\_HPV+} = \text{incidence\_BCC}\times(1-PAF)\times\text{RR\_hrHPV}\)
\(\text{incidence\_BCC\_HPV-} = \text{incidence\_BCC}\times(1-PAF)\)
II. HPV vaccination
- Vaccine coverage
Create 1000 draws of HPV vaccination propensity from an uniform distributon U[0, 1] and use constant propensity for every simulation timestep. We assume no one has been vaccinated on day one of the simulation. At each simulation timestep, give the vaccination to unvaccinated women who at 15 to 45 years of age and has a HPV_vacciation_propensity value less than the current HPV vaccine coverage level. Use the vaccine coverage specified in section 4.1 Simulation scenarios to differentiate coverage threshold between baseline and alternative scenarios.
- Vaccine efficacy
Zhu et al. reported a relative risk of getting HPV 16/18 infection for those unvaccinated versus vaccinated (RR_no_vaccine_hrHPV): use normal distribution normal(mean=4.71, SD=0.94)
Lu et al. reported a relative risk of getting BCC without hrHPV infection for those unvaccinated versus vaccinated (RR_no_vaccine_CIN2+): use normal distribution normal(mean=1.77, SD=0.26)
Use same relative risk (RR_no_vaccine_hrHPV) distribution for people moving from BCC_S_hrHPV to BCC_C_hrHPV and ICC_S_hrHPV to ICC_C_hrHPV among those unvaccinated versus vaccinated.
- relevant formulas
PAF = \(\frac{\text{prev\_vaccine}\times(\text{RR\_vaccine}-1)}{\text{prev\_vaccine}\times(\text{RR\_vaccine}-1)+1}\)
\(\text{incidence\_hrHPV\_with\_vaccine} = \text{incidence\_hrHPV}\times(1-PAF)\)
\(\text{incidence\_hrHPV\_without\_vaccine} = \text{incidence\_hrHPV}\times(1-PAF)\times\text{RR\_no\_vaccine\_hrHPV}\)
\(\text{incidence\_BCC\_S\_hrHPV\_with\_vaccine} = \text{incidence\_BCC}\times(1-PAF)\)
\(\text{incidence\_BCC\_S\_hrHPV\_without\_vaccine} = \text{incidence\_BCC}\times(1-PAF)\times\text{RR\_no\_vaccine\_CIN2+}\)
\(\text{incidence\_hrHPV\_for\_BCC\_S\_hrHPV\_to\_BCC\_C\_hrHPV\_with\_vaccine} = \text{incidence\_hrHPV}\times(1-PAF)\)
\(\text{incidence\_hrHPV\_for\_BCC\_S\_hrHPV\_to\_BCC\_C\_hrHPV\_without\_vaccine} = \text{incidence\_hrHPV}\times(1-PAF)\times\text{RR\_no\_vaccine\_hrHPV}\)
\(\text{incidence\_hrHPV\_for\_ICC\_S\_hrHPV\_to\_ICC\_C\_hrHPV\_with\_vaccine} = \text{incidence\_hrHPV}\times(1-PAF)\)
\(\text{incidence\_hrHPV\_for\_ICC\_S\_hrHPV\_to\_ICC\_C\_hrHPV\_without\_vaccine} = \text{incidence\_hrHPV}\times(1-PAF)\times\text{RR\_no\_vaccine\_hrHPV}\)
5.3.4 Treatment model
PAF = \(\frac{\text{prev\_tx}\times(\text{RR\_tx}-1)}{\text{prev\_tx}\times(\text{RR\_tx}-1)+1}\)
\(\text{incidence\_ICC\_with\_tx} = \text{incidence\_ICC}\times(1-PAF)\)
\(\text{incidence\_ICC\_without\_tx} = \text{incidence\_ICC}\times(1-PAF)\times\text{RR\_no\_tx}\)
prev_tx = baseline screening coverage * treatment coverage among those who attended cervical cancer screening = 25% * 9% = 2.25% (Tai et al. 2018)
RR_no_tx = relative risk of developing CIN3+ for ASCUS women without treatment versus with treatment: use log-normal distribution exp(normal(mean=log(4.86), SD=0.51)) (Tai et al. 2018)
5.4 Input data sources
Input parameter |
Value |
Source |
Note |
|---|---|---|---|
Duration of BCC |
10 years |
||
Mean sojourn time |
4 years |
||
Initial cervical cancer screening coverage |
25% |
It’s an arbitrary number greater than 20.7%. |
|
Target cervical cancer screening coverage in 2030 |
50% |
by assumption |
|
Initial HPV vaccination coverage |
10% |
The current HPV vaccination rates remain low in China, no data has identified. |
|
Target HPV vaccination coverage in 2030 |
25% |
by assumption |
|
Screening sensitivity of co-test |
HPV+: 76.7%; Cytology+: 59.1% |
||
Screening specificity of co-test |
HPV-: 94.1%; Cytology-: 100% |
||
Screening sensitivity of cytology alone test |
65.9% (95% CI 54.9 to 75.3) |
||
Screening specificity of cytology alone test |
100% |
by client’s assumption |
|
Prevalence of HPV |
/ihme/costeffectiveness/vivarium_csu_cancer/hpv_prevalence_dismod.csv |
We used Abie’s dismod 1.1.1 to generate draw-/age- specific prevalence data |
|
Incidence of HPV |
/ihme/costeffectiveness/vivarium_csu_cancer/hpv_incidence_dismod.csv |
We used Abie’s dismod 1.1.1 to generate draw-/age- specific incidence data |
|
remission of HPV |
/ihme/costeffectiveness/vivarium_csu_cancer/hpv_clearance_dismod.csv |
We used Abie’s dismod 1.1.1 to generate draw-/age- specific remission data |
|
Relative risk of HPV |
27.4 (95%CI 19.7 to 38.0); use log-normal distribution exp(normal( mean=log(27.4), SD=0.17)) |
||
HPV vaccine according to protocol efficacy against incident HPV 16/18 infection |
use normal distribution normal(mean=4.71, SD=0.94) |
We convert the efficacy to a relatiev risk of HPV 16/18 infection for those unvaccinated versus vaccinated |
|
HPV vaccine according to protocol efficacy against CIN2+ |
use normal distribution normal(mean=1.77, SD=0.26) |
In this study, CIN2+ was associated with non-16/18 HPV infection (other oncogenic types including 31/33/45/52/58) |
|
BCC treatment coverage |
9% |
proportion of people treated among those who attended cervical cancer screening |
|
BCC treatment efficacy |
0.22 (95%CI 0.07 to 0.68); relative risk of developing CIN3+ for ASCUS women with treatment versus no treatment |
use log-normal distribution exp(normal(mean=log(4.86), SD=0.51)) for inverse distribution |
5.5 Output meta-table shell
Location |
Year |
Birth cohort |
Sex |
Risk group |
Scenario |
Outcome |
|---|---|---|---|---|---|---|
Blended provinces in China |
2020 |
2000-2005 |
Female |
Average risk without HPV infection |
Baseline |
Number of benign cervical cancer cases detected among policyholders |
… |
… |
High risk with HPV infection |
Alternative |
Number of invasive cervical cancer cases detected among policyholders |
||
2040 |
1925-1930 |
Number of deaths from undetected invasive cervical cancer among policyholders |
||||
Change of detected benign cervical cancer cases as compared with baseline |
||||||
Change of detected invasive cervical cancer cases as compared with baseline |
||||||
Change of deaths from undetected invasive cervical cancer as compared with baseline |
6.0 Validation and verification
TBD
7.0 Limitations
TBD
8.0 References
Burger EA, de Kok IMCM, Groene E, et al. Estimating the Natural History of Cervical Carcinogenesis Using Simulation Models: A CISNET Comparative Analysis. J Natl Cancer Inst 2020; 112: 955–63.
Wang B, He M, Chao A, et al. Cervical Cancer Screening Among Adult Women in China, 2010. Oncologist 2015; 20: 627–34.
Schiffman M, Kinney WK, Cheung LC, et al. Relative Performance of HPV and Cytology Components of Cotesting in Cervical Screening. J Natl Cancer Inst 2018; 110: 501–8.
Kripke, C. (2008). Pap smear vs. HPV screening tests for cervical cancer. American Family Physician, 77(12), 1740.
Koliopoulos G, Nyaga VN, Santesso N, et al. Cytology versus HPV testing for cervical cancer screening in the general population. Cochrane Database Syst Rev 2017; 8: CD008587.
Zhao F-H, Lewkowitz AK, Hu S-Y, et al. Prevalence of human papillomavirus and cervical intraepithelial neoplasia in China: a pooled analysis of 17 population-based studies. Int J Cancer 2012; 131: 2929–38.
Kang L-N, Castle PE, Zhao F-H, et al. A prospective study of age trends of high-risk human papillomavirus infection in rural China. BMC Infect Dis 2014; 14: 96.
Naucler P, Ryd W, Törnberg S, et al. HPV type-specific risks of high-grade CIN during 4 years of follow-up: a population-based prospective study. Br J Cancer 2007; 97: 129–32.
Zhu F-C, Hu S-Y, Hong Y, et al. Efficacy, immunogenicity and safety of the AS04-HPV-16/18 vaccine in Chinese women aged 18-25 years: End-of-study results from a phase II/III, randomised, controlled trial. Cancer Med 2019; 8: 6195–211.
Lu B, Kumar A, Castellsagué X, Giuliano AR. Efficacy and safety of prophylactic vaccines against cervical HPV infection and diseases among women: a systematic review & meta-analysis. BMC Infect Dis 2011; 11: 13.