Vivarium wasting paper simulation
1.0 Project overview
This simulation will build on phase I of the severe acute malnutrition elimination model, described here.
The goal of this simulation is to investigate the question:
What is the required treatment volume of MAM (and SAM) under various scale-up and targeting strategies for joint community management of acute malnutrition (for SAM and/or MAM) and small quantity lipid-based nutrient supplementation (SQ-LNS).
We will begin to investigate this question in two waves:
Universal SQ-LNS coverage scale-up strategies (no x-factor)
Targeted SQ-LNS coverage scale-up strategies (utilizing x-factor)
Additional background on the project and resources for publication can be found here.
1.1 Examples of similar analyses
Existing models that utilize dynamic transition models of child wasting include:
Optima Nutrition Model, an adaptation of the Lives Saved Tool (LiST) [Optima-Nutrition-Model], utilized in an analysis by [Scott-et-al-2020]
Work by the Institute for Disease Modeling (IDM), developed to investigate the potential impact of nutritional supplementation on childhood measles burden [Noori-et-al-2021]
2.0 Simulation design
2.1 Default specifications
Parameter |
Value |
Note |
|---|---|---|
Location(s) |
Ethiopia (ID: 179) |
|
Number of draws |
20 |
Needs to be refined based on test runs |
Population size per draw |
100,000 |
Needs to be refined based on test runs |
Age start (initialization) |
Zero |
|
Age start (observation) |
Six months |
Change from phase I |
Age end |
5 years |
|
Exit age |
5 years |
|
Simulation start date |
2021-07-01 |
|
Simulation observation start date |
2022-01-01 |
Starts six months after x-factor burn-in |
Simulation end date |
2026-12-31 |
|
Timestep |
4 days |
Change from phase I, needs to be validated |
2.2 Scenarios
Simulated scenarios will involve some change of coverage/efficacy parameter values for the following interventions, in combination or isolation:
SAM treatment
MAM treatment
SQ-LNS
3a. Universal
3b. Targeted to those with mild wasting
3c. Targeted to those recovered from SAM/MAM treatment
Intervention |
Baseline |
Target |
Zero coverage (*) |
|---|---|---|---|
1: SAM treatment |
Baseline values for \(C_{SAM}\) and \(E_{SAM}\), defined here |
\(C_{SAM} = 0.7\) \(E_{SAM} = 0.75\) |
\(C_{SAM} = 0\) \(E_{SAM} = \text{baseline value}\) |
2: MAM treatment |
Baseline values for \(C_{MAM}\) and \(E_{MAM}\), defined here |
\(C_{MAM} = 0.7\) \(E_{MAM} = 0.75\) |
\(C_{MAM} = 0\) \(E_{MAM} = \text{baseline value}\) |
3: SQ-LNS (all sub-interventions) |
\(C_{SQLNS} = 0\) |
\(C_{SQLNS} = 0.7\) (*) |
\(C_{SQLNS} = 0\) |
Note
(*) in the table above indicates a change from phase I
Note
Model versions 1 through 3.0.1 scaled between the baseline value and the target value accordingly:
For scenarios that feature a scale-up of one of the above interventions, intervention parameters should scale between the baseline and the scale-up values according to the algorithm described here that was used for phase I of the acute malnutrition simulation. For scenarios that feature “zero coverage” of one or more of the above interventions, intervention coverage should immediately change from the baseline to the zero coverage values at the date that the intervention scale-up would have occured according to the algorithm linked above. Intervention parameters should remain at the zero coverage values for the remainder of the simulation.
For model versions 3.0.2 onward, intervention parameters should be set to the value specified in the table below at initialization and remain at this level for the duration of the simulation.
Scenario |
|
|
|
Note |
|---|---|---|---|---|
1: Baseline |
Baseline |
Baseline |
Baseline (0%) |
|
2: Zero coverage |
Zero coverage |
Zero coverage |
Baseline (0%) |
|
3: SAM treatment scale-up, baseline MAM treatment |
Target |
Baseline |
Baseline (0%) |
|
4: SAM treatment scale-up, zero MAM treatment |
Target |
Zero coverage |
Zero coverage |
|
5: MAM treatment scale-up |
Baseline |
\(C_{MAM}\) to baseline \(C_{SAM}\), \(E_{MAM}\) to target \(E_{MAM}\) |
Baseline (0%) |
|
6_incidence: Full scale-up to SAM baseline, |
Baseline |
\(C_{MAM}\) to baseline \(C_{SAM}\), \(E_{MAM}\) to target \(E_{MAM}\) |
3a to baseline \(C_{SAM}\), using SQ-LNS incidence sensitivity analysis effects |
|
6_recovery: Full scale-up to SAM baseline |
Baseline |
\(C_{MAM}\) to baseline \(C_{SAM}\), \(E_{MAM}\) to target \(E_{MAM}\) |
3a to baseline \(C_{SAM}\), using SQ-LNS recovery sensitivity analysis effects |
|
7: MAM and SAM treatment scale-up |
Target |
Target |
Baseline (0%) |
|
8_incidence: Full scale-up to target |
Target |
Target |
3a to target, using SQ-LNS incidence sensitivity analysis effects |
|
8_recovery: Full scale-up to target |
Target |
Target |
3a to target, using SQ-LNS recovery sensitivity analysis effects |
|
9_incidence: SQ-LNS to mildly wasted |
Target |
Target |
3b to target, using SQ-LNS incidence sensitivity analysis effects |
[Second wave that requires x-factor inclusion] |
9_recovery: SQ-LNS to mildly wasted |
Target |
Target |
3b to target, using SQ-LNS recovery sensitivity analysis effects |
[Second wave that requires x-factor inclusion] |
10_incidence: SQ-LNS to SAM and MAM treatment |
Target |
Target |
3c to target, using SQ-LNS incidence sensitivity analysis effects |
[Second wave that requires x-factor inclusion] |
10_recovery: SQ-LNS to SAM and MAM treatment |
Target |
Target |
3c to target, using SQ-LNS recovery sensitivity analysis effects |
[Second wave that requires x-factor inclusion] |
Note
We may add/remove scenarios based on results of existing list
Additional scenarios to consider include one in which SQ-LNS coverage is scaled-up to baseline coverage of CMAM screenings (\(C_{SAM}\)) and coverage of MAM and SAM treatment are increased by some magnitude as well. There is some evidence to suggest that administering SQ-LNS at CMAM screenings may increase screening coverage [Huybregts-et-al-2019]; however, we chose not to model this scenario as the paper ultimately did not find an impact on treatment coverage. As more evidence on this topic becomes available, we may consider including this scenario in our model.
2.2.1 Scenarios for emulator inputs
This section refers to a subset of scenarios intended for use in building and testing the separate Nutrition Intervention Optimization simulation.
Note, for all emulator input scenarios, use baseline values for \(E_{SAM}\) and \(E_{MAM}\) parameters. Additionally, use the SQ-LNS incidence sensitivity analysis effects.
Scenario |
SQ-LNS coverage |
MAM treatment coverage |
SAM treatment coverage |
|---|---|---|---|
E1 |
0 |
0 |
0 |
E2 |
1 |
0 |
0 |
E3 |
0 |
1 |
0 |
E4 |
0 |
0 |
1 |
E5 |
1 |
1 |
0 |
E6 |
1 |
0 |
1 |
E7 |
0 |
1 |
1 |
E8 |
1 |
1 |
1 |
2.3 Modelling components
2.3.1 Concept model diagram
Note
X-factor will be included in the second wave of model runs/scenarios only

2.3.1.1 Cause Models
2.3.1.2 Joint Cause-Risk Models
2.3.1.3 Risk Exposure Models
2.3.1.4 Risk Effects Models
Child Stunting Risk Effects (GBD 2020)
Child Wasting Risk Effects (GBD 2020), NOTE: use the risk effect on diarrheal diseases described here
X-factor Risk Effects, for wave 2 model runs only
Note
Do not incude Diarrheal Diseases Risk Effects
2.3.1.5 Intervention Models
Important
A note on coverage propensities:
We would ideally like to use the same coverage propensity for all modeled interventions (MAM treatment, SAM treatment, and SQ-LNS). In other words, at the same coverage level, the same simulants should be covered by all 3 interventions and the remaining simulants should be covered by zero interventions.
However, we used non-fixed propensity values for the Treatment and management for acute malnutrition model to avoid V&V issues as discussed on the intervention model document.
Given this model limitation, we will model *independent* coverage propensities of the SQ-LNS intervention and MAM/SAM treatment.
Todo
Consider adding mortality impacts? We’re thinking no for now.
2.4 Outputs
Primary simulation outcomes (for each scenario):
Number of incident MAM and SAM cases per 100,000 PY
Number of treated MAM and SAM cases per 100,000 PY
Person-time spent utilizing SQ-LNS per 100,000 PY
Prevalence of wasting and stunting
All-cause mortality rates
All-cause YLL rates
Cause-specific YLD rates
Secondary simulation outcomes
Relative risk for all-cause mortality by intervention coverage (for comparison with trial data)
Person-time spent covered by SQ-LNS per 100,000 PY (see difference between coverage and utilization here)
Mean difference of time-to-recovery of MAM and SAM by wasting treatment status
Simulation outcomes needed for verification and validation only:
Cause incidence, remission, and excess mortality rates
Wasting and stunting risk effects
Effect of SQ-LNS intervention
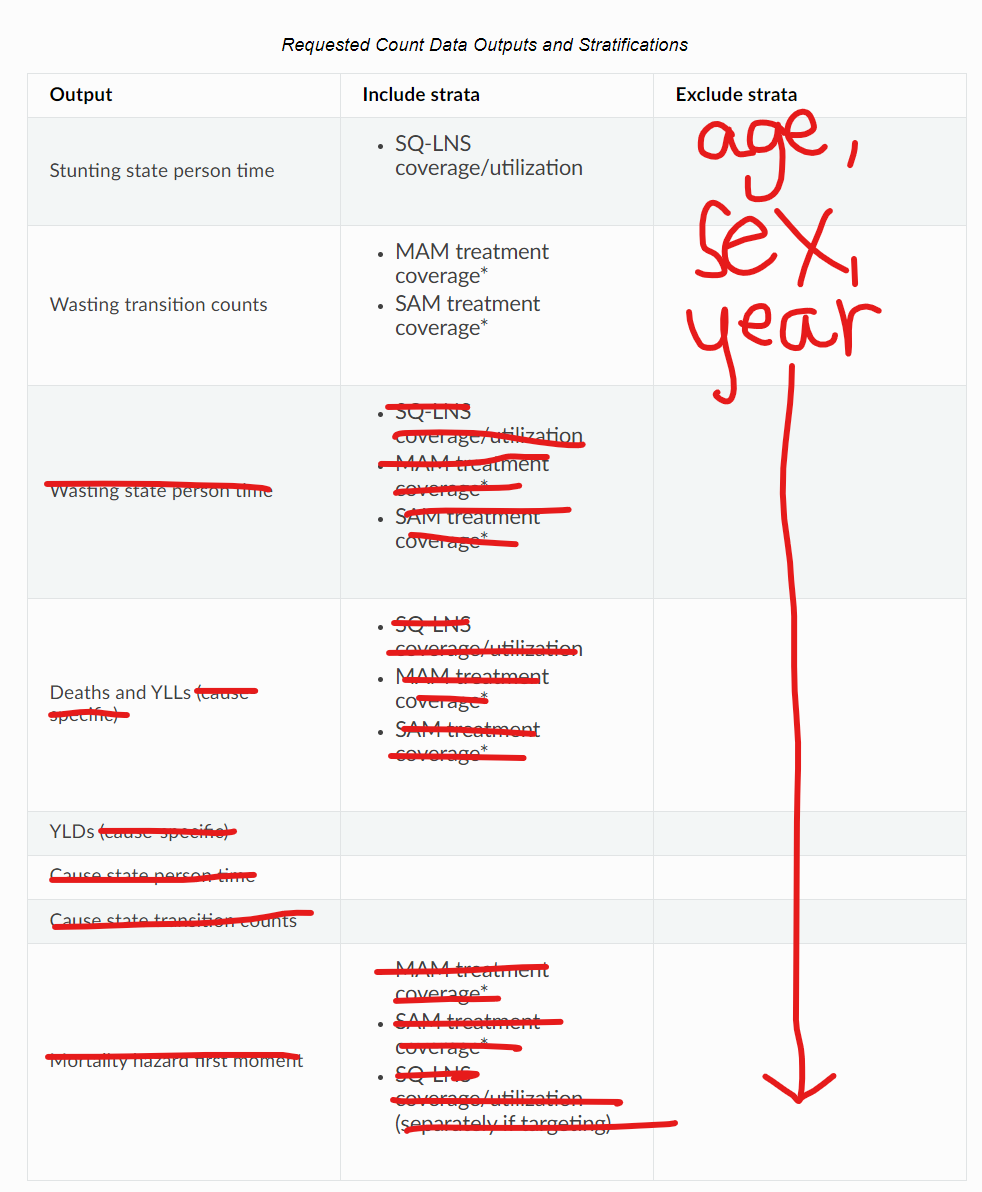
Requested outputs for primary and secondary outcomes with minimum required stratification beyond defaults (additional stratification requested below if needed for V&V):
Default strata:
Age
Sex
Year
Output |
Include strata |
Exclude strata |
|---|---|---|
Stunting state person time |
|
|
Wasting transition counts |
|
|
Wasting state person time |
|
|
Deaths and YLLs (cause-specific) |
|
|
YLDs (cause-specific) |
||
Cause state person time |
||
Cause state transition counts |
||
Mortality hazard first moment |
|
Note
The mortality hazard first moment should be recorded as the sum of each simulant’s all-cause mortality hazard multiplied by the person-time spent with that mortality hazard for each observed stratum. This observer is an attempt to measure the expected differences in mortality between scenarios without the influence of stochastic uncertainty, which will enable us to run the simulation with smaller population sizes.
3.0 Models
Model development priorities:
Concept model updates
1a. Updated model components
Keep without changes: SQ-LNS intervention, MAM treatment intervention, SAM treatment intervention, wasting transition risk factor, stunting risk factor, protein energy malnutrition cause, measles cause
Change: Diarrheal diseases and lower respiratory infections causes (to most recent versions used in IV iron), update risk effect of wasting to apply to diarrheal diseases incidence rate rather than excess mortality rate
Remove from previous model: LBWSG risk factor, maternal supplementation intervention, insecticide treated net intervention, zinc supplementation intervention, diarrheal diseases risk effects, x-factor risk factor (for now), maternal BMI risk factor
1b. Simulation outputs
Update outputs and stratification to match tables above
1c. Model specification changes
Update simulation timestep from 0.5 days to 4 days
Change simulation age start from birth to six months
Update SQ-LNS intervention details (except for targeting implementation)
Change SQ-LNS coverage age-end parameter from 5 to 2 years
Update effect of SQ-LNS on wasting to new sex-specific values
Scenario implementation
First run for a sub-set of scenarios with increased population size and number of draws to assess how many to use moving forward (detailed in model request table below)
Then, run all scenarios with determined population size and number of draws
Assess computational resource requirements and joint decision about additional locations
Update SQ-LNS parameters based on collaborator feedback and new data
SQ-LNS effects on stunting persist until five years of age (use new SQ-LNS coverage definition)
Updated effect sizes and effect size application strategy for SQ-LNS effects on stunting
SQ-LNS effects on wasting apply to additional transition rates, introduce sensitivity analysis (new scenarios)
Stratify mortality hazard first moment observer by intervention coverage
SQ-LNS utilization algorithms and targeted scenarios
SQ-LNS targeting implementation (new code!)
Include x-factor risk in model. Note that research team will need to pass off calibration values.
Note
Model run requests may be added to this table for iterative verification and validation processes
Run |
Description |
Scenarios |
Specification modifications |
Stratificaction modifications |
Note |
|---|---|---|---|---|---|
1.0 Baseline concept model updates |
Includes relevant model components, updated outputs, updated model specs. |
1 |
|
Stratify cause state person time and cause transition counts by wasting and stunting state (for V&V of risk effects) |
No x-factor component. V&V baseline model before moving on (cause models, risk effects, MAM/SAM treatment effects) |
2.0 SQ-LNS updates |
Updates to SQ-LNS age-end parameter, sex-specific effect size |
6 |
Default (20 draws, 100,000 population size) |
Wasting transition counts stratified by SQ-LNS coverage/utilization (for V&V of SQ-LNS intervention effect) |
No x-factor component. V&V SQ-LNS effect and intervention scale-up before moving on. |
3.0: Alternative scenario runs, stratified by seed |
Subset of scenarios to determine desired number of draws and population sizes |
4, 7, 8 |
50 draws, 200,000 population size |
Count data results stratified by random seed for optimization |
No x-factor component. V&V zero coverage implementation before moving on. |
3.0.1: Updates and larger population size |
Model 3.0 bugfixes, implement mortality hazard rate observer, remove intervention scale-up, subset of draws and larger population size |
4, 7, 8 |
Draw numbers |
Count data results stratified by random seed for optimization |
No x-factor component. V&V zero coverage implementation before moving on |
3.1: SQ-LNS updates |
Update SQ-LNS intervention in accordance with this PR (step #4 in the model development priorities list above), ensure mortality first hazard observer is stratified by intervention coverage, remove children under 6 months from observers |
7, 8_incidence, 8_recovery |
Draw numbers |
Count data results stratified by random seed for optimization |
No x-factor component. V&V SQ-LNS updates before moving on |
3.1.1: Run-time test |
Remove lots of stratification and record runtime for planning purposes in the nutrition optimization model |
1 |
1 draw, population size 250,000 |
Don’t need results, only runtime statistics. |
|
3.1.2: Emulator runs |
Run select scenarios with little stratification to use in building and testing emulator for nutrition optimization project |
E1 through E8, defined here |
2 draws, population size 100,000 per draw |
Same stratifications and outputs as run 3.1.1 |
|
3.1.2.1: Emulator runs with more draws and 100% max coverage |
Run select scenarios with little stratification to use in building and testing emulator for nutrition optimization project. Note maximum intervention coverage has been increased from 0.7 in run 3.1.2 to 1 in run 3.1.2.1 |
E1 through E8, defined here |
20 draws, population size 100,000 per draw |
Same stratifications and outputs as run 3.1.1 |
|
3.1.3 |
Updated age-specific SQLNS effects on wasting, additional stratifications, updated initialization age start value (from 0.5 to 0). All changes included in pull request #1114 |
7, 8_incidence, 8_recovery |
Draw numbers |
Count data results stratified by random seed for optimization |
No x-factor component |
4.0: All wave 1 scenarios |
Full wave 1 scenarios |
1 through 8 |
35 draws and population size of 250,000 per draw |
Default |
No x-factor component. May be run for additional locations depending on computational resource requirements. |
Model |
Description |
V&V summary |
|---|---|---|
1.0 |
Baseline concept model updates |
V&V notebooks for model 1.0 can be found here. V&V criteria satisfied. |
2.0 |
SQ-LNS intervention updates |
|
3.0 |
Subset of scenarios stratified by random seed |
|
3.0.1 |
Bugfixes, scale-up removal, increased population size for subset of draws |
|
3.1 |
Updated SQ-LNS intervention in accordance with this PR, mortality first hazard observer is stratified by intervention coverage, removed children under 6 months from observers |
|
Issue |
Explanation |
Action plan |
Timeline |
|---|---|---|---|
Simulants aged 0-6 months not present at initialization, resulting in missing age cohort over time |
Discrepancy between age start and entrance age |
Set age start value to 0 (instead of six months) |
For next model run |
Assumptions and Limitations
We assume independent coverage propensities between our modeled interventions. Say someone has SAM and does not have access to treatment but spontaneously recovers to MAM – it is possible for this person to then be treated for MAM in our model. While possible, this is probably unlikely in reality. Additionally, while we expect our modeled interventions to estimate impact on total incident wasting cases reasonably, we will likely underestimate the potential impact of SQ-LNS on treated wasting cases as SQ-LNS coverage will not be concentrated among those who are covered by CMAM services.
Our definition of MAM and SAM treatment coverage is probability rather than capacity based (probability of receiving treatment given that you need treatment does not change as the overall number of children who need treatment changes), which is likely not reflective of real-world resource availability/constraints.
References
Huybregts L, Le Port A, Becquey E, Zongrone A, Barba FM, Rawat R, Leroy JL, Ruel MT. Impact on child acute malnutrition of integrating small-quantity lipid-based nutrient supplements into community-level screening for acute malnutrition: A cluster-randomized controlled trial in Mali. PLoS Med. 2019 Aug 27;16(8):e1002892. doi: 10.1371/journal.pmed.1002892. PMID: 31454356; PMCID: PMC6711497.
View Noori et al. 2021
Navideh Noori, Laura A. Skrip, Assaf P. Oron, Kevin A. McCarthy, Benjamin M. Althouse, Indi Trehan, Kevin P.Q. Phelan. Potential Impacts of Mass Nutritional Supplementation on Dynamics of Measles: A Simulation Study. medRxiv 2021.09.10.21263402; doi: https://doi.org/10.1101/2021.09.10.21263402
Pearson R, Killedar M, Petravic J, Kakietek JJ, Scott N, Grantham KL, Stuart RM, Kedziora DJ, Kerr CC, Skordis-Worrall J, Shekar M, Wilson DP. Optima Nutrition: an allocative efficiency tool to reduce childhood stunting by better targeting of nutrition-related interventions. BMC Public Health. 2018 Mar 20;18(1):384. doi: 10.1186/s12889-018-5294-z. Erratum in: BMC Public Health. 2018 Apr 26;18(1):555. https://pubmed.ncbi.nlm.nih.gov/29558915
Scott, N., Delport, D., Hainsworth, S. et al. Ending malnutrition in all its forms requires scaling up proven nutrition interventions and much more: a 129-country analysis. BMC Med 18, 356 (2020). https://doi.org/10.1186/s12916-020-01786-5