Small quantity lipid based nutrient supplements (SQ-LNS)
Todo
Update the note with the newest information added once the subnational targeted approach has been documented
Note
This page underwent a revision in December of 2022 to reflect an a desired modeling strategy update of the phase II acute malnutrition simulation in response to updated effect size data and feedback obtained from collaborators. The pull request associated with these updates can be found here. A summary of the associated changes to the modeling strategy includes:
Data changes to effect of SQ-LNS on moderate and severe stunting
Change to how stunting effects are applied (increases in stunting TMREL category rather than mild stunting category)
SQ-LNS effects on stunting will persist until 5 years of age instead of ceasing at 2 years of age
SQ-LNS impacts on each wasting transition rate (including remission rates) rather than only the transition rate between mild and moderate wasting
Prior to the update in December of 2022, this page underwent a revision in August of 2022 to reflect desired modeling strategy of the phase II acute malnutrition simulation updated from the strategy used for the phase I acute malnutrition simulation.
The PRs associated with these updates are listed below.
A summary of the associated changes to modeling strategy includes:
Reduction in the age end parameter from 5 years to 2 years
Update of the effect size on child wasting in accordance with newly published literature, also now sex-specific
New utilization algorithms
Potential for new intervention effect on ACMR (not currently included in this document)
Additional changes associated with the September 2023 update are listed below and can be found in this PR
Reduction in the age end parameter from 2 years to 18 months
Data update to new wasting transition rate effects for wave I of the nutrition optimization simulation
Change in age thresholds for different SQLNS/wasting effect sizes.
Ideally, infants are breastfed for two years or longer, with complementary food introduced at six months of age. Diets of infants and young children aged six to 23 months need to include a variety of nutrient-dense foods, preferably from local sources, to ensure their nutrient needs are met. However, children’s diets are likely to be deficient in macronutrients and micronutrients, specifically essential fatty acids, when nutrient-rich diets are not available to them in resource-poor settings. Various interventions are recommended, or have been used, to improve child malnutrition. This document focuses on small quantity lipid based nutrient supplements (SQ-LNS) as an intervention to improve malnutrition, particularly child wasting and stunting. Particularly, it draws on the 2019 Cochrane Review by Das et. al. [DAS_Cochrane_Review_2019]
Abbreviation |
Definition |
Note |
|---|---|---|
LNS |
lipid-based nutrient supplements |
|
SQ |
small quantity |
|
FBF |
fortified blended foods |
|
CSB ++ |
corn soy blend plus |
|
MNP |
Multiple micronutrient powders |
Intervention Overview
Lipid-based nutrient supplements
Supplementary feeding is a strategy that includes provision of extra food to children beyond the normal ration of their home diets and is aimed at improving the nutritional status or preventing the nutritional deterioration of the target population. One of the nutritional interventions advocated to address malnutrition among children is lipid-based nutrient supplements (LNS). LNS are a family of products designed to deliver nutrients to vulnerable people. They are considered ‘lipid-based’ because most of the energy provided by these products is from lipids (fats). All LNS provide a range of vitamins and minerals, but unlike most other micronutrient supplements, LNS also provide energy, protein and essential fatty acids. LNS recipes can include a variety of ingredients, but typically have included vegetable fat, peanut or groundnut paste, milk powder and sugar. Based on the energy content, LNS can be small quantity (SQ LNS) providing ˜ 110 to 120 kcal/day (20 g dose), medium quantity (MQ LNS) providing ˜ 250 to 500 kcal/day (45 g to 90 g dose) or large-quantity (LQ LNS) providing more than 280 kcal/day (> 90 g dose). Notably, MQ-LNS and LQ-LNS can be used in management of acute malnutrition interventions. Additionally, antenatal supplementation with balanced energy protein (BEP) utilitizes LNS products. LNS are nutrient dense, require no cooking before use, and can be stored for months even in warm conditions. [DAS_Cochrane_Review_2019]
Alternative recipes and formulations, other than LNS
Alternative recipes and formulations, other than LNS, are currently being explored using cereals mixed with other ingredients, including whey, soy protein isolate, dried skimmed milk, and sesame, cashew and chickpea paste, among others. These are fortified with vitamins and minerals and are commonly called fortified blended foods (FBF). An example of a commonly used FBF is corn soy blend plus (CSB ++), which is a cooked blend of milled, heat-treated corn and soybeans that is fortified with a vitamin and mineral premix. Multiple micronutrient powders (MNP) are also an alternative way of providing micronutrients. These are single-dose packets of vitamins and minerals in powder form that can be sprinkled onto any ready to eat semi-solid food consumed at home, school or any other point of use. [DAS_Cochrane_Review_2019]
Description of intervention
The intervention is the supplementation of children from aged 6 months to 23 months with LNS + complementary feeding (intervention) compared with no intervention (control). The setting of the intervention is the community.
Summary of existing intervention literature
There have been several recent meta-analyses on the effects of SQ-LNS, outlined below:
A Cochrane systematic review and meta-analysis [DAS_Cochrane_Review_2019]. Please see this memo for a summary of the studies and the effect sizes
SQ-LNS interventions memoA meta-analysis of RCTs on all-cause mortality [Stewart-et-al-2020]
All-cause mortality was significantly lower in the SQ-LNS arm than the non-SQ-LNS arm (RR: 0.73; 95% CI: 0.59, 0.89; 13 trials)
A series of individual participant data meta-analyses (with analysis of effect modification), as summarized by [Dewey-et-al-2021a]. These papers included eligible studies from the review published by [DAS_Cochrane_Review_2019] as well as additional data published following the publication of the cochrane review. Minimum supplementation duration for inclusion was three months between the ages of six and 24 months of age. Most studies began supplementation at six months of age with intended supplementation duration of 6-18 months. The series included individual analyses on the following outcomes:
Growth outcomes: [Dewey-et-al-2021b]
Stunting prevalence ratio: 0.88 (95% CI: 0.85, 0.91)
Wasting prevalence ratio: 0.86 (95% CI: 0.80, 0.93) and acute malnutrition prevalence ratio: 0.86 (95% CI: 0.80, 0.93)
Effect modified by sex
Severe growth outcomes: [Dewey-et-al-2022]
Severe stunting prevalence ratio: 0.83 (95% CI: 0.78, 0.90)
Severe wasting prevalence ration: 0.69 (95% CI: 0.55, 0.86)
Concurrent severe stunting and severe wasting prevalence ratio: 0.47 (0.30, 0.73)
Effects modified by level of wasting and stunting burden
Anemia and micronutrient status: [Wessells-et-al-2021]
Significantly decreased anemia and vitamin A deficiency
No effect on plasma zinc or retinol
Developmental outcomes: [Prado-et-al-2021]
Increased mean language, social-emotional, and motor scores.
Increased prevalence of walking without support at 12 months
Note, we have received data directly from the [Dewey-et-al-2021b] authors on the 4-category severity-specific prevalence ratios of SQ-LNS wasting and stunting. This data can be found at J:Projectsimulation_scienceciff_malnutritionDatasqlns_effects. There are two files present in this location.
ipd_list_request_20220727.xlsx Contains meta-analyzed prevalence ratios of SQ-LNS on four-category wasting and stunting prevalence, both overall and stratified by region (Africa only, Bangladesh only). The prevalence ratios (PR) in this file are calculated using standard prevalence measures (for example, the PR for SQ-LNS on severe stunting is equal to the prevalence of severe stunting among the SQ-LNS-exposed group divided by the prevalence of severe stunting among the non-SQ-LNS-exposed group, where prevalence is the proportion of the population with severe stunting).
ipd_list_request_20240620.xlsx Contains meta-analyzed effect of SQ-LNS on four-category wasting and stunting prevalence, both overall and stratified by wasting and stunting burden level (enabling evaluation of SQLNS effect modification by background wasting and stunting burden). WARNING: the measures of effect in this file are NOT prevalence ratios. Rather, they are measures of effect on a ratio measure of the prevalence of given wasting or stunting category relative to the prevalence of all other wasting or stunting categories that are “healthier” than it. For example, the measure of effect of SQLNS on moderate stunting in this file is a ratio of the prevalence of moderate stunting divided by the combined prevalence of mild stunting and no stunting among the SQ-LNS exposed population relative to that same measure among the SQ-LNS unexposed population.
The relevant values from each of these files have been compiled into a single CSV found here.
Warning
In the nutrition optimization subnational analyses as of March 2026, we have erroneously applied ratio-based measures of effects as prevalence ratios for the wasting 10-18 month age group (although not for the 6-10 month age group) as well as for stunting effects specifically for the effect modified sensitivity analyses. See the Wasting and Stunting sections below for more details and modeling implications.
Baseline Coverage Data
No baseline coverage of SQ-LNS (0%)
Vivarium Modeling Strategy
Utilization algorithms
We will consider two concepts of SQ-LNS services, including coverage and utilization:
1. Coverage: access to the intervention (such as living in an area where SQ-LNS products are available and in use). This will be determined by coverage scale-up algorithms in the concept model document.
Possible coverage values include:
Uncovered: Not supplemented by SQ-LNS currently or in the past. Simulants aged 6 months to 5 years are eligible for this category.
Covered: Actively receiving SQ-LNS supplementation. Simulants aged 6 months to 18 months are eligible for this category. Simulants in this category are subject to the SQ-LNS effects on wasting and stunting.
NOTE: our model assumes that SQ-LNS coverage is not interrupted if/when a child is being treated for acute malnutrition
Received: No longer actively receiving SQ-LNS supplementation, but did receive SQ-LNS supplementation before the age of 18 months. Simulants aged 18 months to 5 years are eligible for this category. Simulants in this category are subject to the SQ-LNS effects on stunting, but not wasting.
2. Utilization: use of the intervention (actually taking the supplements and receiving the effects). This will be determined by the utilization algorithms below.
There are various SQ-LNS utilization algorithms that may be desired under differing scenarios. They include:
Universal coverage: All covered simulants receive effects starting at six months of age.
Targeted to AM treatment: Covered simulants who transition from MAM or SAM to mild wasting will receive intervention effects starting at that timestep.
Targeted to mild wasting: Covered simulants who are initialized into or transition into the mild wasting state will receive intervention effects starting at that timestep.
SQ-LNS effects on wasting will persist until 18 months of age and effects on stunting will persist until five years of age.
Restriction |
Value |
Note |
|---|---|---|
Male only |
No |
|
Female only |
No |
|
Age group start |
6 months |
|
Age group end (exclusive) |
18 months |
Children >18 months of age not eligible |
Other |
Targeted SQ-LNS
The team ran the model for each subnational location with SQ-LNS “on” and “off” and tested different targeting plans for SQ-LNS in an emulator, see below. The goal of this approach was to allow for more extensive testing of different possible targeting approaches and the option to run a regression and create a more complex metric.
To achieve this, we created an emulator to combine results from individual subnationals where SQ-LNS is on and off and compare the relative effectiveness of different targetting. The metrics used for generating targeting lists were: wasting prevalence, stunting prevalence, underweight prevalence, under 5 mortality, food insecurity, and a composite metric based on the Global Hunger Index (https://www.globalhungerindex.org/methodology.html). The GHI composite score was calculated here. The food insecurity is based on IPC classifications (https://www.ipcinfo.org/). All other values are from GBD.
This is the emultor for SQ-LNS targeting and this is the functions file.
An example of the main figure generated in this analysis is below, comparing the ICER from SQ-LNS and the GHI score in Nigeria.
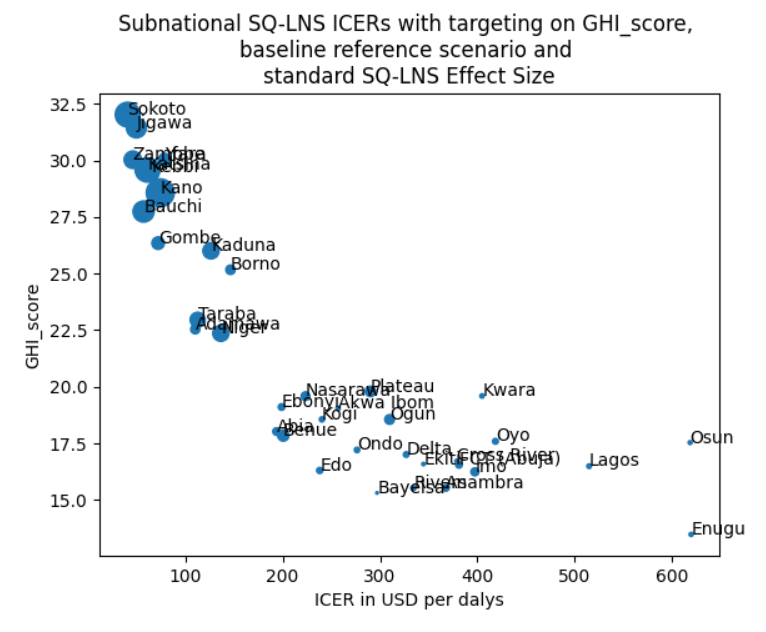
While we will continue to explore targeting and sensitivity metrics, for use in Model 18 (https://vivarium-research.readthedocs.io/en/latest/models/concept_models/vivarium_nutrition_optimization/kids/concept_model.html#wave-iii) we have selected the GHI composite metrics to use for targeting.
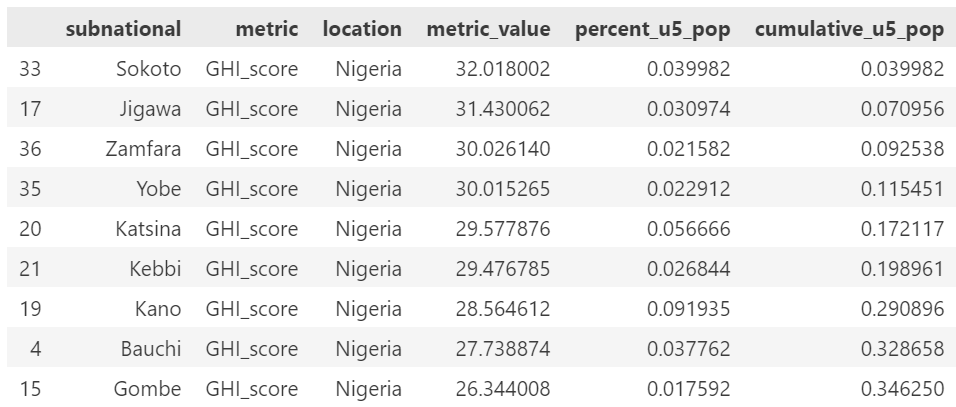
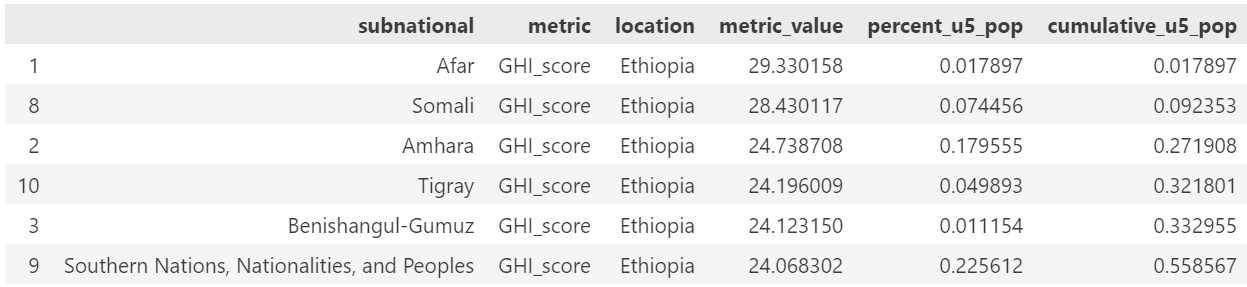
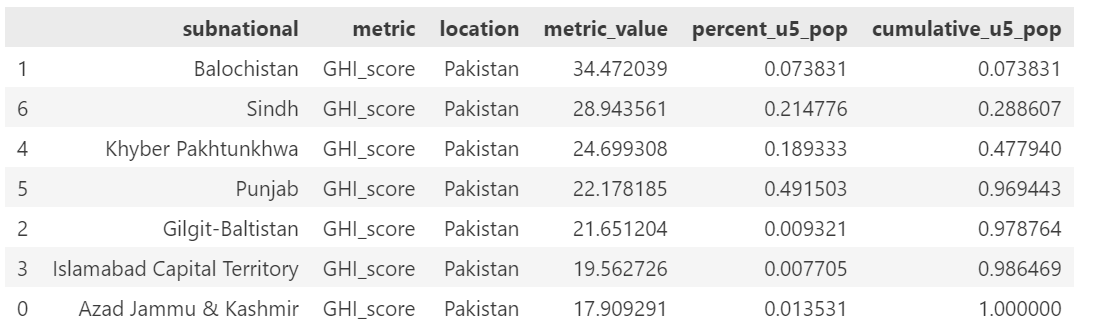
We had planned to target approximately 20% of the population but due to constraints on size of population included based on the subnational sizes, we ended up targeting 30% of the population. Below are the subnational locations for each country, in rank order of GHI score and including the cumulative percent of the population.
The included list of subnational locations to target is:
Nigeria: Sokoto, Jigawa, Zamfara, Yobe, Katsina, Kebbi, Kano
Ethiopia: Afar, Somali, Amhara
Pakistan: Balochistan, Sindh
Nigeria:
Ethiopia:
Pakistan:
The WHO has issued guidelines on the use and targeting of SQ-LNS, which are available here: WHO guidelines. These guidelines state that “in areas of or during periods of high food insecurity” providing SQ-LNS or similar food supplementation might be appropriate. They state that targeting to a geographic region or to specific children or households might be appropriate. Additionally they recommend using the food security metric to determine targeting.
However, these guidelines are quite vague. This is a relatively new intervention and so the best metric for targeting is still being debated. Simulation is especially well suited for these types of questions, and so we will try several different SQ-LNS targeting criteria.
Note
The WHO guidelines included above state that targeting should be based off of food security, more specifically it should be targeted to those who are severely food insecure. Based on FAOSTAT data, this would be when approximately 20% of the population is targeted as severaly food insecure. We are using underweight as a proxy for severe food insecurity as it is already in our model, and it is a better representation of concurrent stunting and wasting - which is more dangerous that stunting or wasting alone.
Additionally, Indi Trehan recommended using underweight as a metric. Weight is more commonly tracked in practice than height, making this data more available than stunting or wasting.
A preliminary version of targeting based on underweight was created in this notebook. However, we are waiting for confirmation from Rahul before continuing with this approach. This food insecurity target list can be used as a placeholder for testing the model to run targeted SQ-LNS.
Affected Outcomes
Effect Modification
The effect size of SQ-LNS has been shown to change based on stunting or wasting prevalence in a location [Dewey-et-al-2022]. Therefore, we are including a sensitivity analysis where there are two SQ-LNS effect sizes - based on if the subnational location surpasses a wasting prevalence threshold of 10%. This is separate from targeting.
Wasting prevalence was selected over stunting because the other interventions in our model focus on wasting treatment (SAM and MAM treatment), and therefore the prevention vs treatment framework is most relevant and interesting in high wasting burden locations. At current, we are waiting for input from Indi Trehan on guidance for whether wasting or stunting is a more appropriate effect modifier to use.
The effect modified impact on stunting and wasting were calulated in the same way as the standard impacts. We first identified the subnational locations that would receive the higher and lower effect sizes using this SQLNS effect modification testing notebook, and then used the same process as before to generate the wasting transition impacts.
We again received data inputs from the team at UC Davis showing the prevalence ratio for each
category separated by high and low burden locations. This data is stored at J:Projectsimulation_scienceciff_malnutritionDatasqlns_effectsipd_list request_20240620.xlsx.
The trials included in this meta-analysis were identical to those included in the prior meta-analysis.
The new data here was the prevalence ratios separated by high and low burden regions.
In generating the wasting transition data from the prevalence ratios, we encountered a few limitations:
The upper bound of the prevalence ratio for low burden regions was greater than 1. This would imply that SQ-LNS has a negative impact. For our model, we set the upper limit to be exactly 1, indicating no impact. This is implemented in cell [2] of the effect generation notebook, in the line validation_targets_ucl_low_burden = [1.0, 1.0, 1.0, 1.01].
For the lower bounds, sometimes the limits were lower than could be achieved in our nanosim. In these cases, we do not hit the prevalence ratio at 10 months. We reach the prevalence ratio later, or in some cases approach it without fully acheiving it. We believe this is a reasonable limitation. The plot for Balochistan in the effect generation notebook shows an example of this.
Wasting
Note
These values changed in both the 8/22, 12/22, and 9/23 updates
Since the effect of SQ-LNS on child wasting was measured in prevalence ratios, it is not known whether SQ-LNS reduces wasting prevalence through a reduction of wasting incidence or duration. Therefore, we will run a sensitivity analysis in which SQ-LNS affects wasting incidence rates and another in which SQ-LNS affects wasting recovery rates. There is some evidence from [Huybregts-et-al-2019-sqlns] that SQ-LNS affects the incidence of acute malnutrition and some evidence that it may affect time to recovery, although it appears that the pathway through incidence is the primary route by which SQ-LNS impacts wasting prevalence from this limited evidence.
Additionally, due to the multi-compartment transition model of child wasting used in our simulation, we cannot apply the observed prevalence ratios directly to wasting transition rates to replicate the intended prevalence ratios. Rather, we solved for specific transition rate ratios (separately for incidence and recovery rates) that resulted in the intended prevalence ratios of SQ-LNS. Due to the finding by [Huybregts-et-al-2019-sqlns] that “the difference between study arms in the probability of developing the first AM episode mainly occurred during the first 4 months of follow-up and then remained constant” (p. 19), we decided to implement age-specific effects such that for those who begin SQ-LNS supplementation at six months of age, the prevalence ratios from the meta-analysis are achieved at 12 months of age and maintained through 23 months of age.
For standard SQ-LNS effects for which we have data measured in standard prevalence ratios, we calibrated incidence rate effects to replicate prevalence ratios. However, for the SQ-LNS effects modified by wasting burden, we only have the custom ratio-based measures of effects. In these cases, we calibrated the incidence rate effects among 6-10 month olds to replicate these ratio-based measures. However, we did NOT account for the ratio-based nature of these effects in the analytic portion of our SQ-LNS effect generation. This will cause us to overestimate the impact of SQLNS on mild and moderate wasting in our scenarios with SQLNS effect modification. Notably, this overestimation will be present for both the high and low burden locations, but there is expected to be a greater degree of overestimation in the high burden locations than the low burden locations (as those locations have a greater prevalence of wasting and therefore the ratios will differ from prevalence to a greater degree). Therefore, the impact of applying these ratio based effects as prevalence ratios in our analytic solution for SQLNS effects on wasting transition rates will exaggerate the degree of effect modification between high and low burden locations. Given that this approach makes it less likely for our analyses to be robust to effect modification sensitivity analysis, we decided to accept this limitation for our targeted SQ-LNS publication given that the conclusion is that our analyses are in fact robust to SQLNS effect modification. We will plan not to directly report results from this effect modification analysis given these known issues. Note that there should be an analytic solution to convert from the ratio-based to prevalence-based effects if needed, but it has not been pursued as of March 2026.
Note that we will need to structure our V&V of SQLNS effects so that we evaluate the prevalence-based impacts for standard effects and the ratio-based impacts for modified effects. See an example here.
Notebooks that generated these values can be found here:
Nutrition optimization implementation (9/23 update that uses wasting transition rates from Wave I of the nutrition optimization model). Note that only incidence effects have been calculated for this project, as they are thought to be the primary route through which SQ-LNS affects child wasting, although we may revisit this assumption after more investigation into individual SQ-LNS trials that may provide guidance.
Subnational optimization by location (5/29 update to have location specific values). No changes in approach, this was an adjustment to run for many locations successfully only.
Subnational optimization with effect modification. This includes the new effect modification for all locations. The data used in the model.
Wasting transition rates affected by SQ-LNS are documented on the dynamic wasting transition model document. The intervention effect should apply immediately upon coverage of the intervention and should be applied multiplicatively to the affected measure.
The SQ-LNS effects on wasting transition rates should apply to simulants covered by SQ-LNS from the start of coverage (at six months of age) until they are 18 months of age, at which point SQ-LNS should no longer affect their transition rates. In other words, the covered SQ-LNS coverage state affects wasting transitions rates, but the received and uncovered states do not.
Note
Lognormal distributions of uncertainty should be used for all effect sizes in the table below and the uncertainty intervals. We have confirmed that the lognormal distribution reasonably replicates the uncertainty intervals for these effects in this SQLNS dsitribution check notebook.
The same percentile should be sampled from within each uncertainty interval for ALL of the effect samples (across age groups and measures) for each draw of the simulation.
Outcome |
Sensitivity analysis |
6 to 10 months |
10 to 18 months |
Note |
|---|---|---|---|---|
i3 rate from wasting TMREL to mild wasting |
Incidence effects |
0.8 (0.71, 0.93) |
0.9 (0.84, 0.96) |
|
i2 rate from mild wasting to MAM |
Incidence effects |
0.7 (0.57, 0.88) |
0.9 (0.83, 0.97) |
Should apply equally to transitions into “worse” MAM and “better” MAM substates |
i1 rate from MAM to SAM |
Incidence effects |
0.3 (0.15, 0.68) |
0.79 (0.64, 0.895) |
Should apply equally to transitions originated from “worse” MAM and “better” MAM substates |
r4 rate from mild wasting to wasting TMREL |
Recovery effects |
1 |
1 |
|
r3 rate from MAM to mild wasting |
Recovery effects |
1 |
1 |
|
r1 (SAM to MAM) and t1 (SAM to mild) rates |
Recovery effects |
1 |
1 |
Apply this effect to both r1 and t1 transition rates |
Note
We reviewed the individual studies included in [Dewey-et-al-2021b] to check if any evaluated the effects of SQ-LNS on wasting incidence rather than prevalence ([Dewey-et-al-2021b] focused on prevalence). Few RCTs reported on incidence, but those that did had similar findings as our back-calculated incidence values (e.g., [Huybregts-et-al-2019-sqlns]).
1st episode of AM |
0.71 |
|---|---|
All episodes of AM |
0.69 |
Relapse |
0.81 |
[Becquey-et-al-2019] reported lower or null incidence rate effects than we use in our model, but they also found low or null effects of SQLNS on prevalence and recovery as well, so we believe their results to not be representative based on what we know about overall SQLNS effects from [Dewey-et-al-2021b].
None of the RCTs included in [Dewey-et-al-2021b] reported on recovery rates. However, [Huybregts-et-al-2019-sqlns] found no significant difference in the length of treatment between the group that received SQ-LNS and those that didn’t. This confirms our assumption that SQ-LNS works via reducing incidence rather than speeding up recovery.
For more info on this work, please visit the Sharepoint folder that contains notes and PDFs of all the studies included in [Dewey-et-al-2021b].
Stunting
Note
These values changed in the December, but not August, 2022 update
We will apply the SQ-LNS prevalence ratios on the stunting risk exposure distribution among simulants covered by SQ-LNS from the start of supplementation (six months of age) until they turn five years of age. In other words, both the covered and received SQ-LNS coverage states affect stunting, but the uncovered state does not. The application of the SQ-LNS effect on stunting through five years of age (beyond the duration of supplementation) was advised by collaborators, with the rationale that height gains achieved during SQ-LNS supplementation will persist throughout life (unlike wasting-associated weight gains).
Additionally, as suggested by the observed prevalence ratios from the meta-analysis, we will assume that SQ-LNS results in decreases to the prevalence of moderate and severe stunting, no change to the prevalence of mild stunting, and increases to the stunting TMREL category that are equal to the sum of the decreases in prevalence of moderate and severe stunting. The figure below demonstrates how to apply the effects summarized in the table to the stunting risk exposure distribution of simulants affected by SQ-LNS.
Outcome |
Effect size measure |
Sensitivity analysis |
Effect size |
Note |
|---|---|---|---|---|
Moderate (cat2) stunting exposure |
Prevalence ratio |
Standard effects |
0.89 (0.86, 0.93), lognormal distribution of uncertainty |
Effect is a standard prevalence ratio |
Moderate (cat2) stunting exposure |
Prevalence ratio |
Modified effects |
0.83 (0.78, 0.89) in high burden areas, lognormal distribution of uncertainty 0.87 (0.77, 0.98) in low burden areas, lognormal distribution of uncertainty |
Effect is the custom ratio-based measure (prevalence of moderate stunting / prevalence of mild and no stunting combined) among the SQLNS group relative to the no SQLNS group. These custom ratio-based measures were erroneously applied as prevalence ratios in the nutrition optimization simulation (see this V&V notebook). While we do not have prevalence ratio modified effects to compare to, the ratio-based standard effects systematically exaggerate the impact of SQLNS on moderate stunting relative to the prevalence-based standard effects (a 14% vs 11% reduction in moderate stunting), implying that this error will cause us to systematically overestimate the impact of SQLNS on moderate stunting in our simulation. Note that since the magnitude of this bias is relativly modest and the modified SQLNS effects were included only as a sensitivity analysis, we have accepted this limitation for now. If we were to revisit this in the future, we should ideally obtain prevalence-based modified effects on child stunting or construct a calibration calculation to convert the ratio-based effects to prevalence-based effects for application to our simulation. |
Severe (cat1) stunting exposure |
Prevalence ratio |
Standard effects |
0.83 (0.78, 0.90), lognormal distribution of uncertainty |
Effect is a standard prevalence ratio |
Severe (cat1) stunting exposure |
Prevalence ratio |
Modified effects |
0.78 (0.65, 0.93) in high burden areas, lognormal distribution of uncertainty 0.92 (0.83, 1.02) in low burden areas, lognormal distribution of uncertainty |
Similar to the modified effect on moderate stunting, this effect is the custom ratio-based measure rather than a prevalence ratio. Notably, there is no difference in the ratio- and prevalence-based standard SQLNS effects on severe stunting (likely because the prevalence of severe stunting is low, causing the prevalence to approximate the ratio based measure of severe stunting / (moderate, mild, and no stunting combined)). |
Note
Similar to the effects on Wasting, erroneously applying ratio-based effects as prevalence ratios is expected to overestimate the effect of SQLNS on stunting in our effect modified sensitivity analysis for both high and low burden locations, but to a greater degree for high burden locations. Because this will cause us to overestimate the degree of effect modification and therefore make it less likely to conclude that our results are robust to the effect modification sensitivity analysis, we have decided to accept this as a limitation given that our conclusion is that our results are already robust to this sensitivity analysis. We will plan not to directly report results from this sensitivity analysis. Note that there should be an analytic solution to convert between the ratio-based and prevalence-based measures, but it has not been pursued as of March 2026.

Mortality
Todo
Determine if necessary to include in model… we think no, but this should be discussed in limitations/assumptions of the simulation
Hemoglobin/Anemia
Not currently modeled as part of the wasting simulation given that only YLDs will be affected.
Vitamin A Deficiency
Not currently modeled as part of the wasting simulation as this is not a primary outcome of interest and any downstream effects on mortality will be included in the Mortality outcome above.
Cost Model
Assumptions and Limitations
We assume a constant effect of SQ-LNS wasting transition rates. This means that wasting prevalence ratios will equal 1 at the start of supplementation and progress towards the measured prevalence ratios until they reach a level of stability at some later point. We make this assumption in the absence of measured prevalence ratios as mutliple follow-up points.
We assume that these effect generalize from the populations included in the meta-analysis of SQ-LNS trials to our simulated populations.
Our model assumes that SQ-LNS coverage is not interrupted while a child is being treated for acute malnutrition. This runs counter to protocols such as the one in [Huybregts-et-al-2019-sqlns] that states that SQ-LNS was only distributed to children who were assessed as without acute malnutrition at the CMAM screening. Therefore, we assume that the effects on stunting exposure are maintained regardless of wasting exposure or wasting treatment and additionally assume that SQ-LNS effects on the transition rate from MAM to SAM are maintained regardless of MAM treatment status despite there not being direct evidence to support this modeling decision. Note that our costing model of SQ-LNS could be designed to pause costs associated with SQ-LNS coverage while on active AM treatment (although this was notably not done for the Nutrition Optimization methods publication)
Validation and Verification Criteria
verification: coverage of SQ-LNS as a function of time and eligible populations in baseline and intervention scenario
verification: prevalence of stunting in supplemented vs non-supplemented group
verification: wasting transition rates in supplemented vs non-supplemented group
validation: check that the wasting prevalence ratios replicate the desired values
References
View Becquey et al 2019
Impact on child acute malnutrition of integrating a preventive nutrition package into facility-based screening for acute malnutrition during well-baby consultation: A cluster-randomized controlled trial in Burkina Faso
View Dewey et al 2021a
Dewey KG, Stewart CP, Wessells KR, Prado EL, Arnold CD. Small-quantity lipid-based nutrient supplements for the prevention of child malnutrition and promotion of healthy development: overview of individual participant data meta-analysis and programmatic implications. Am J Clin Nutr. 2021 Nov 2;114(Suppl 1):3S-14S. doi: 10.1093/ajcn/nqab279. PMID: 34590696; PMCID: PMC8560310.
View Dewey et al 2021b
Dewey KG, Wessells KR, Arnold CD, Prado EL, Abbeddou S, Adu-Afarwuah S, Ali H, Arnold BF, Ashorn P, Ashorn U, et al. Characteristics that modify the effect of small-quantity lipid-based nutrient supplementation on child growth: an individual participant data meta-analysis of randomized controlled trials. Am J Clin Nutr 2021;114(Suppl 11):15S–42S.
View Dewey et al. 2022
Dewey KG, Arnold CD, Wessells KR, Prado EL, Abbeddou S, Adu-Afarwuah S, Ali H, Arnold BF, Ashorn P, Ashorn U, Ashraf S, Becquey E, Brown KH, Christian P, Colford JM Jr, Dulience SJ, Fernald LC, Galasso E, Hallamaa L, Hess SY, Humphrey JH, Huybregts L, Iannotti LL, Jannat K, Lartey A, Le Port A, Leroy JL, Luby SP, Maleta K, Matias SL, Mbuya MN, Mridha MK, Nkhoma M, Null C, Paul RR, Okronipa H, Ouédraogo JB, Pickering AJ, Prendergast AJ, Ruel M, Shaikh S, Weber AM, Wolff P, Zongrone A, Stewart CP. Preventive small-quantity lipid-based nutrient supplements reduce severe wasting and severe stunting among young children: an individual participant data meta-analysis of randomized controlled trials. Am J Clin Nutr. 2022 Nov;116(5):1314-1333. doi: 10.1093/ajcn/nqac232. Epub 2023 Feb 10. PMID: 36045000.
Huybregts L, Le Port A, Becquey E, Zongrone A, Barba FM, Rawat R, Leroy JL, Ruel MT. Impact on child acute malnutrition of integrating small-quantity lipid-based nutrient supplements into community-level screening for acute malnutrition: A cluster-randomized controlled trial in Mali. PLoS Med. 2019 Aug 27;16(8):e1002892. doi: 10.1371/journal.pmed.1002892. PMID: 31454356; PMCID: PMC6711497.
View Prado et al. 2021
Prado EL, Arnold CD, Wessells KR, Stewart CP, Abbeddou S, Adu- Afarwuah S, Arnold BF, Ashorn U, Ashorn P, Becquey E, et al. Smallquantity lipid-based nutrient supplements for children age 6–24 months: a systematic review and individual participant data meta-analysis of effects on developmental outcomes and effect modifiers. Am J Clin Nutr2021;114(Suppl 11):43S–67S.
View Stewart et al 2021
Stewart CP,Wessells KR, Arnold CD, Huybregts L, Ashorn P, Becquey E, Humphrey JH, Dewey KG. Lipid-based nutrient supplements and all-cause mortality in children 6–24 months of age: a meta-analysis of randomized controlled trials. Am J Clin Nutr 2020;111:207–18.
View Wessels et al 2021
Wessells K, Arnold C, Stewart C, Prado E, Abbeddou S, Adu- Afarwuah S, Arnold BF, Ashorn P, Ashorn U, Becquey E, et al. Characteristics that modify the effect of small-quantity lipid-based nutrient supplementation on child anemia and micronutrient status: an individual participant data meta-analysis of randomized controlled trials. Am J Clin Nutr2021;114(Suppl 11):68S–94S.