Basic Debugging
Debugging is an art and science that we couldn’t hope to cover on this single page. Rather than attempt such foolishness, we review a few simple techniques in the context of a targeted example here. If you find your bug to be outside the scope of this page, it’s likely time to ask an engineer for help.
For the purpose of this debugging example, we will be working with an intentionally set error to see how the error messages appear and how to read them.
Say we are building an artifact (more information on the artifact
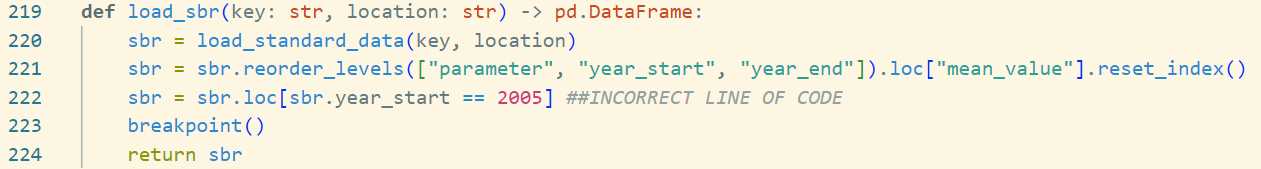
building page) and working on the function
load_sbr
in the loader.py file (more information about file types can be found in the
overview of engineering files page). In this
function, a line of code we edit filters a dataset incorrectly.
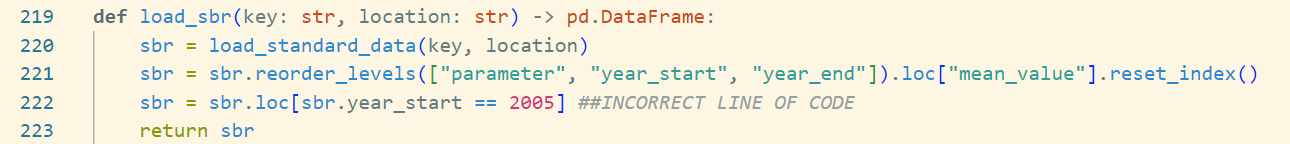
You can see in the photo above, we have added line 222, where we incorrectly added a line filtering the dataset to the year 2005. This will lead to the returned dataset being empty, since the year 2005 is not present in the data.
Let’s see how this might show up in the code, and how we’d debug it.
Making Sense of the Stack Trace
When the model runs into an error, it outputs a “stack trace” or “traceback” along with the error message. The stack trace shows what Python was doing when it encountered the error. Often the immediate line of code that generated the error will be significantly removed from the line of code that will need to be changed to fix the error.
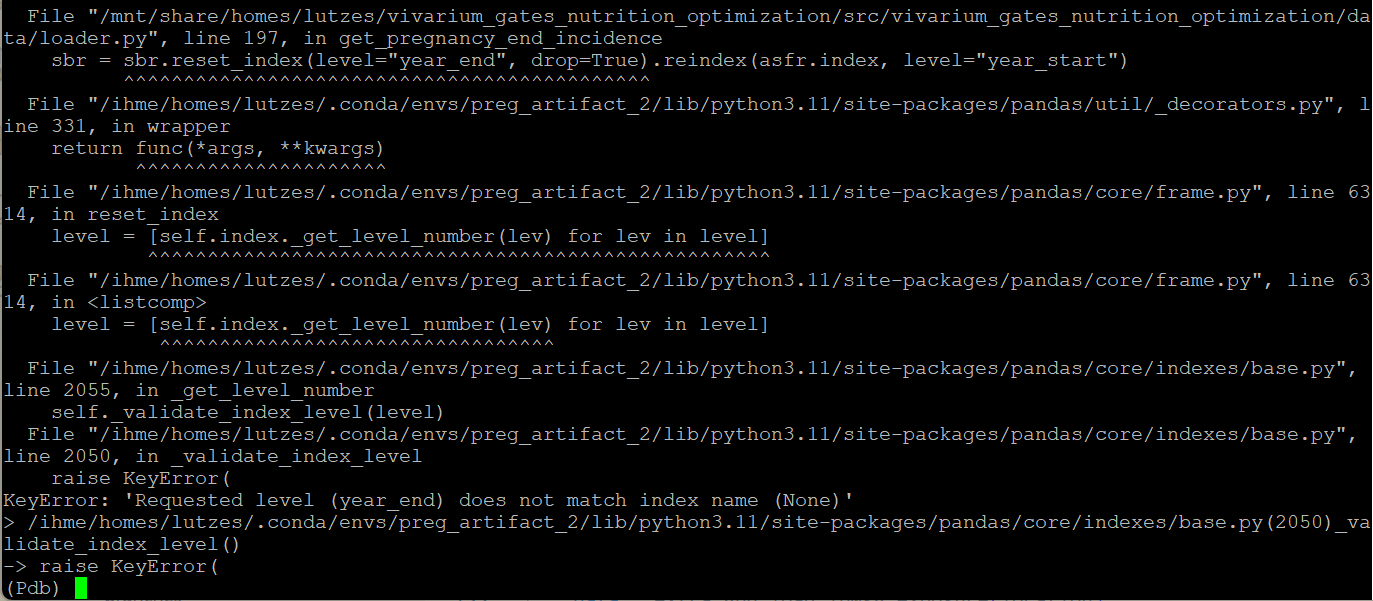
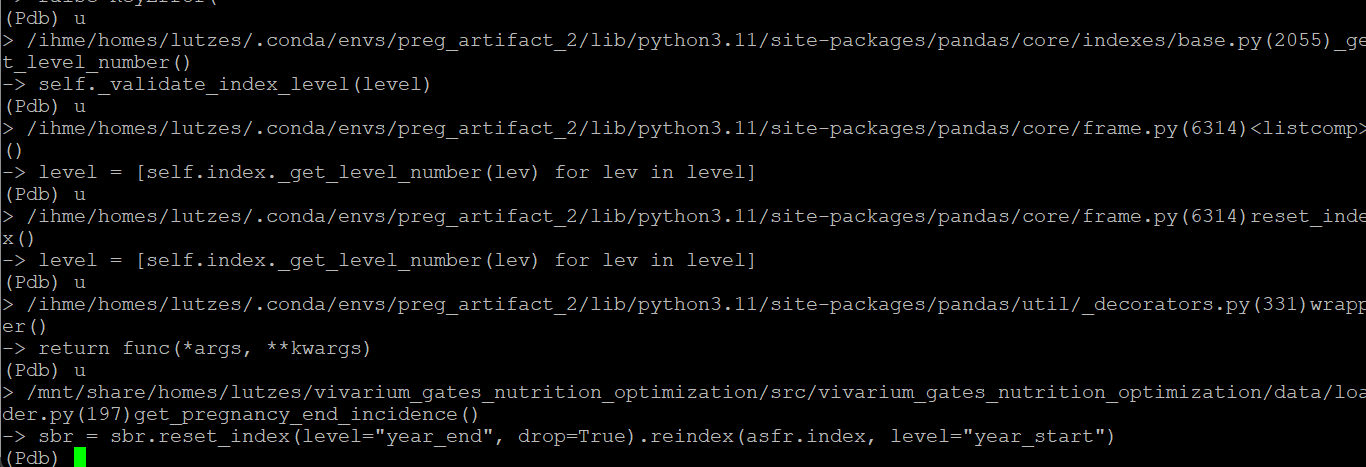
For our example, let’s look at two photos of the stack trace
output. The first is the immediate output you see. This is quite
difficult to read, and as you can see, the bottom lines of the traceback,
which are the most immediate code that failed, just show an error within
pandas code. Above that, we can start to see the error
being traced through calls in the loader.py file.
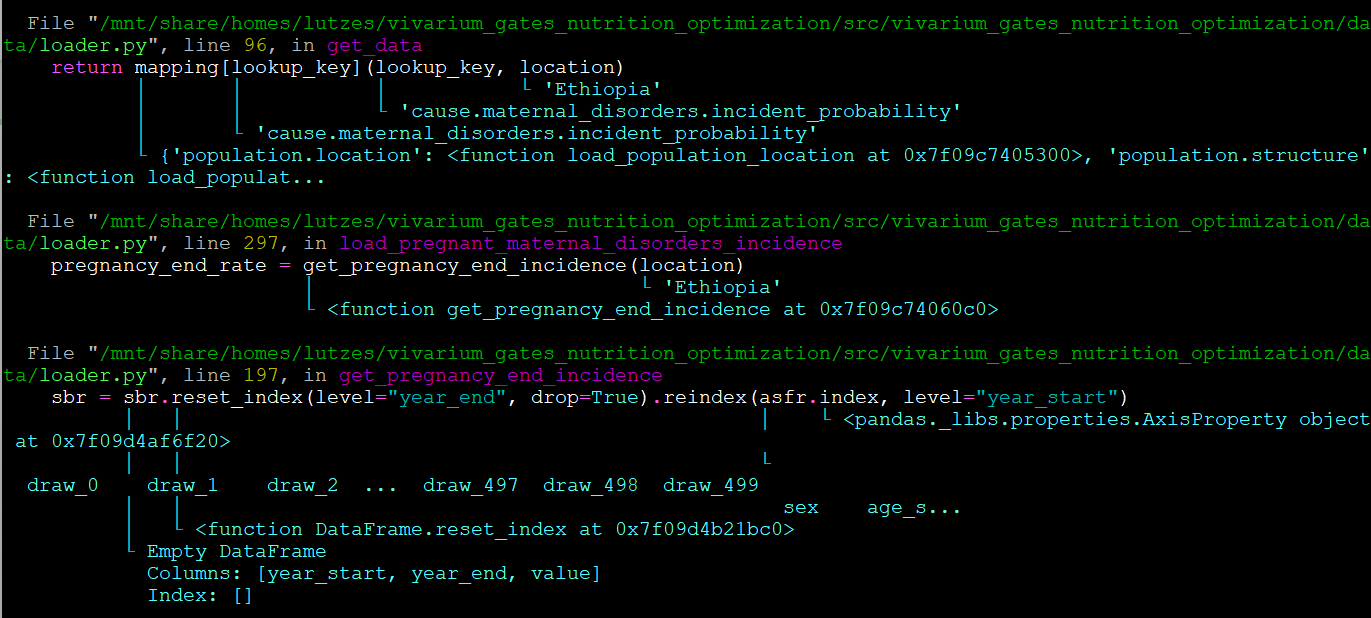
The second photo is a formatted version of the stack trace that
might be outputted based on your terminal and version of python.
It contains most of the same information, but with nicer coloring and
added information on the
parameters used at each point in the call, and notably includes
more relevant information - the lines of code in loader.py
that failed. If this doesn’t appear, try updating python, or explore
new terminal options.
Sometimes, it will be apparent from the stack trace where the bug in the code is. However, sometimes it won’t be. Here, we see that the line of code we know is wrong (line 222 from the intro) isn’t listed anywhere in the stack trace.
Different errors might produce different outputs. You might see lines in the stack trace
from pandas functions, other functions in loader.py, or
functions from other packages, like vivarium_research or vivarium_public_health.
As you can see from this example, the stack trace can be both helpful and unhelpful.
In general, look through the files to see if you can get back to something
you wrote or edited - like the loader.py file. If so, this is a good
place to start looking for issues, and the stack trace will provide the line
number of the code that caused the error.
Otherwise, see the next section for how to use the Python debugger.
Navigating the Python Debugger
In all of the commands used to make artifacts, run simulations, or make results, the
flag --pdb is used, which means that when an error
occurs, you will be placed into the Python debugger.
Let’s continue with the example above, where we got an error in a pandas checking function.
The Python debugger places you at the end of the stack trace -
so we are currently sitting in a pandas error message function.
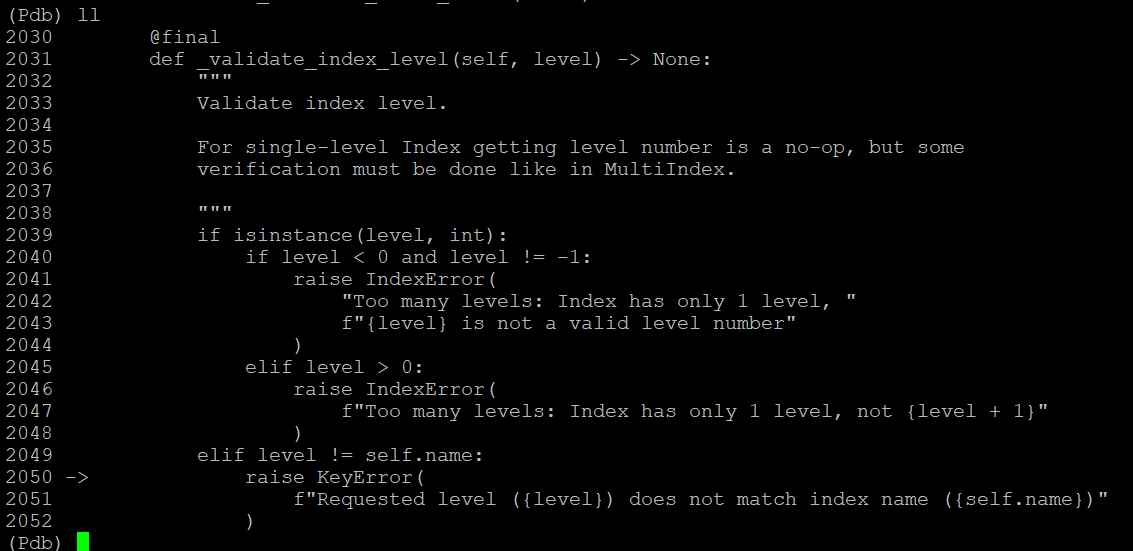
We can check this by typing l or ll which prints
the code around the current line (l), or a longer version of this
print out (ll). This will let you see what the code surrounding the
error is. In our example, typing ll will show the photo below,
which is a pandas checking function showing an error with levels in the
data frames.
Next, you can move up or down the call stack with u or
d respectively. The stack is the code you’re currently
running, and what function called the current one, and what
function called that one, and so on, all the way up the top. It
should match what is printed for you in the stack trace. The “trace”
is the output when the error is found.
Since we start at the bottom of the stack, we will move up first.
By entering u, we move through the pandas functions
until finally we reach the line in our loader.py function.
Note: it can
often take several times entering u to get to a useful
point in the code. Don’t be surprised if you need to move up a lot!
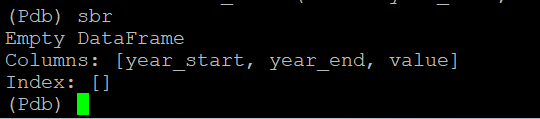
Now in the debugger, we are “located” in the loader.py function
that started this error. Since the debugger is “in” this line of code,
the objects at that point in the code are able to be called. For example,
we can print or manipulate the dataframes being worked with. The code
for this in the Python debugger is the same as used in
a Jupyter notebook. By printing the sbr dataframe, we
discover that it is empty - and the issue is more clear!
From there, we can look at the code generating the empty dataframe. Maybe you see the error quickly. But if not, we’ll probably want to add a breakpoint.
To quit the Python debugger, enter quit.
Adding Breakpoints
So, we have identified the issue is an empty dataframe. Let’s keep debugging! The dataframe in question is generated in a function not in our stack trace. This means we’ll have trouble getting to it with the Python debugger. We’ll need to set a breakpoint.
A breakpoint is a line of code breakpoint() that “breaks”
the code. So when this line is read, the model will drop you into a
Python debugger at that point in the code. So in our example, we might
set a breakpoint in the function which creates the empty dataframe.
Since we know that the sbr dataframe is empty, we can look at
the load_sbr function and add a breakpoint, see the image below.
Once in the Python debugger, we can use a similar process to the above.
Start by printing the dataframe. If it’s empty, the issue is earlier
in the code. If the dataframe is still correct, the issue is later.
You can use up and down to see functions calling the current one,
as in the debugger. You can also step forward (s) to run
the next line of code and then drop back into the debugger.
In this manner, you can check what your dataframes look like before and after each
line runs and find which line is the issue. From there, you can investigate the line
and fix the bug.
If you need to use multiple breakpoints, you can also use the
command c for continue, to move until the next breakpoint.
Assessing Outputs While Debugging
It is often helpful to check outputs you receive while coding to ensure that they are correct. The above information only applies to bugs that throw errors. What if we didn’t use our empty dataframe again, and so instead of receiving an error message, we just accidentally saved the empty dataframe to the artifact? We might not notice until we got incorrect results from a simulation run!
It would be helpful to check some of these outputs along the way to catch these types of errors earlier and be able to fix them. To do this, we recommend having a file, or Jupyter notebook open to run some basic checks.
Information on working in VS Code with the cluster is available here and there is more in-depth information in the Onboarding Resources section of Vivarium Research <computing>, you can run Jupyter notebooks while creating the artifact from the command line. This will allow you to run active checks on outputs as you create them.
Todo
Add in link to onboarding docs where VS Code set-up lives once that section is written.
Additionally, if you find an error in an artifact key, this will allow you to remove it, fix the code, and rerun the artifact generation for that key quickly and efficiently. Here is an example of an artifact checking notebook. This file assess the artifact keys for missing data, incorrect parameters and other basic items that would cause errors in the sim.
Continued Learning
Debugging is a very complex skill. Should you wish to continue your learning more generally, here are some resources:
Docs for the Python debugger with additional commands: https://docs.python.org/3/library/pdb.html
A software carpentry module on testing and debugging: https://paris-swc.github.io/python-testing-debugging-profiling/index.html